At Profound, we love data
At Profound, we gather hundreds of millions of conversations every month from third-party data providers. This richness of data, data being real user queries into answer engines like ChatGPT and others, has enabled us to recently launch Intent in Prompt Volumes, where we categorize and go a level deeper into these hundreds of millions of chat interactions.
We ask ourselves countless questions every day: how do people use answer engines? Why do they prompt ChatGPT, Claude, or Perplexity? How can we break this down by topic and subtopic? Are users researching, shopping, or exploring? And given all these dimensions, how can we dig deeper into a corpus that’s high-dimensional, noisy, and incredibly dense?
In this blog post, we'll do a deep dive on how our Data team found an answer to these questions and more.
But let’s take a step back: we couldn’t always ask these questions, because at the beginning of this year, we didn’t have that much data - and we couldn’t afford to buy that much of it before our Series A.
Profound’s Mixture of Experts

Sid Chandrappa worked on financial models trading billions of dollars at Bridgewater, and now Sid has shipped models parsing billions of prompts at Profound.
How did Sid get here? In the UK, Cambridge’s Part III, its world-famous Master’s in Mathematics, is one of the most rigorous math programs on earth, attracting around 200 mathematicians each year to tackle ambitious problems in a setting that produced minds like Alan Turing and Stephen Hawking. There, Sid focused on Modern Changepoint Analysis.
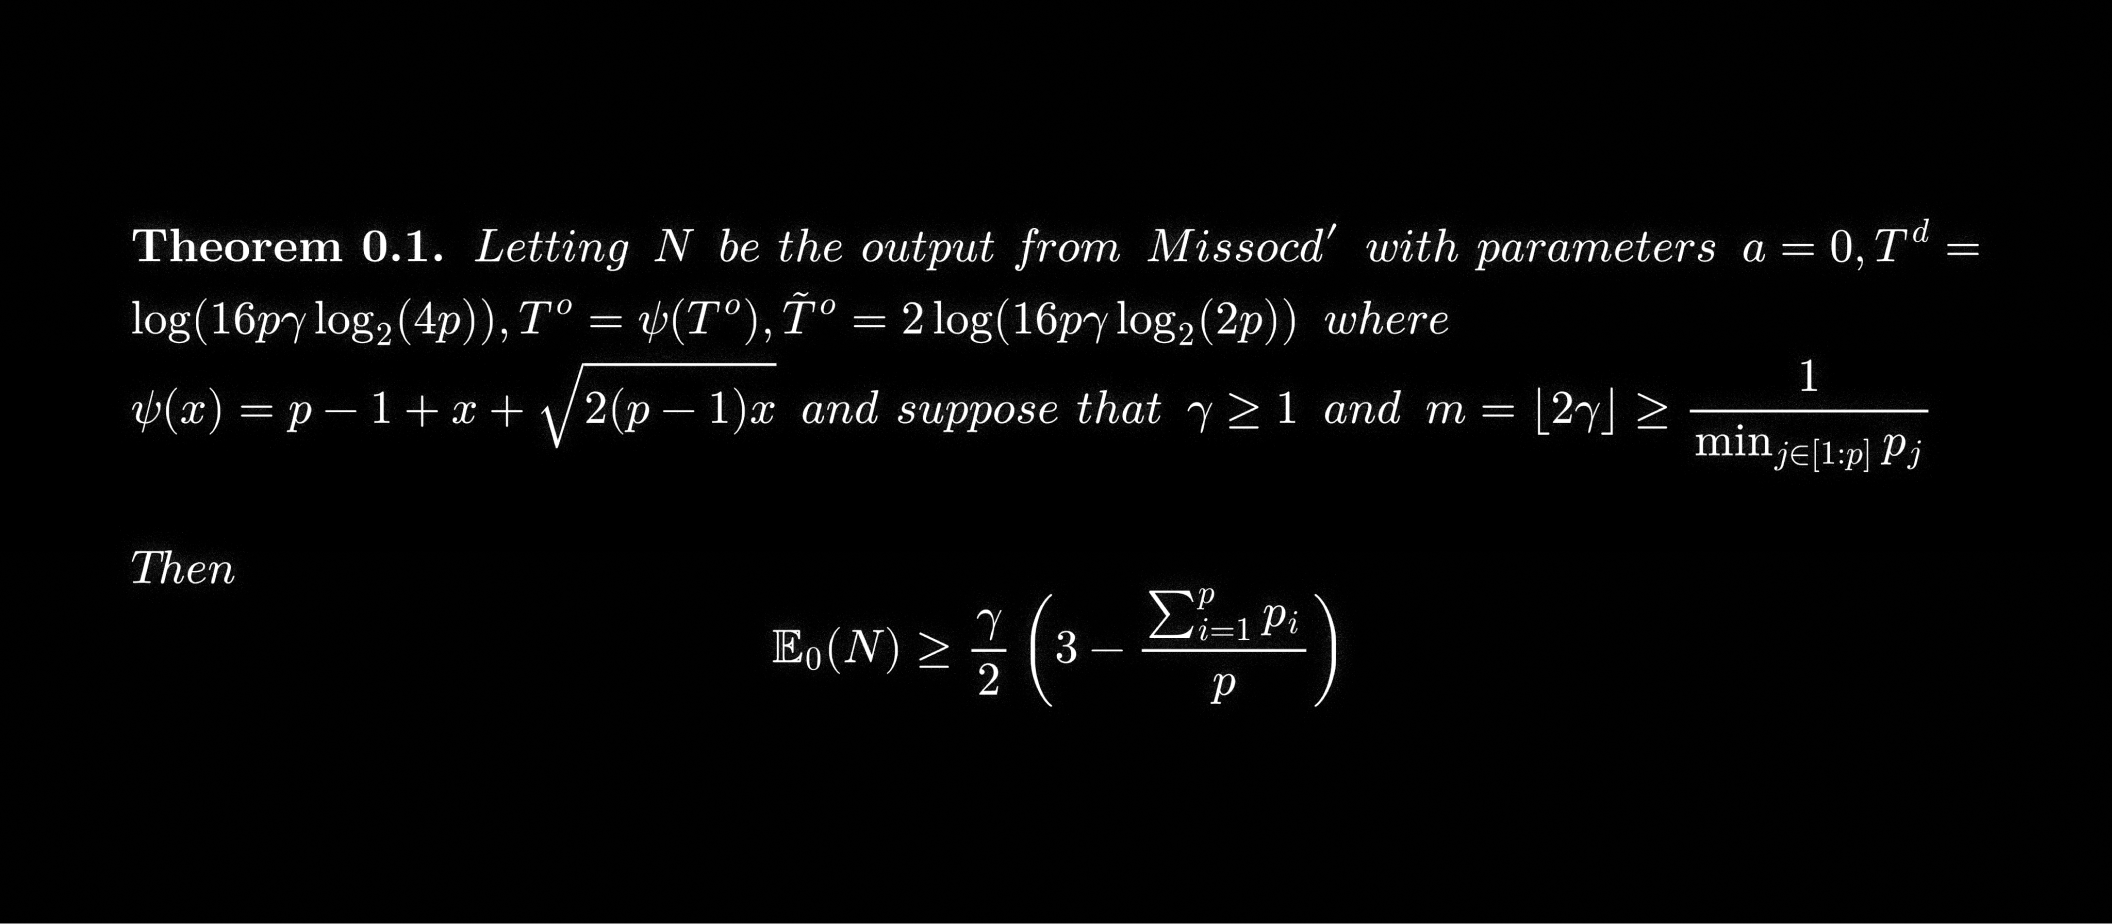
Changepoint Analysis tackles a deceptively simple question: can we mathematically prove that a sensor can detect real shifts in data distribution, accurately, quickly, and without false alarms? Sid’s thesis introduced an algorithm that answers this from first principles.
Ali Vaghar is from Iran, where he studied engineering and economics at Sharif University, a renown engineering school in Iran. Fascinated by the idea of “engineering the economy,” he came to the United States to become a professional economist, but academia did not feel as exciting, so he left.
Before Profound, Ali was at an NYC-based startup called Cybersyn, working to build what was envisioned as the “data economy in real time.” He spent tens of millions of dollars licensing or collecting datasets from credit cards, point-of-sales, and web traffic, and stitching them together to create a unique panel that could answer the question of “where do consumers spend their time and money?”
After leaving Cybersyn, Ali reconnected with Dylan Babbs, with whom he had previously crossed paths at Uber. The two shared a vision how to measure the presence of users and brands inside AI. It was another incredibly unique data problem and one that was hard to say no to.
At Profound, Sid met Ali. Sid brought his first-principles mathematical and statistical rigor to Profound. Ali brought his commercial sense and his background in data licensing and building data products.
With this, let’s dive in.
Getting the Data
We didn’t always have a billion-entry, multi-dimensional data problem. Before our Series A, our dataset was relatively sparse, just a few hundred thousand entries, but we had one conviction from the start: data hides stories. That belief is why Profound was created and why it still exists. While SEO analytics tools like Google Trends exposed web search patterns, we saw an unexplored frontier in generative search. How do people use answer engines like ChatGPT or Perplexity? How often are specific topics prompted? To find out, we began by studying topic popularity across LLMs and built the groundwork for what would later become intent in prompt volumes.
Our biggest challenge was sparsity. Even with strong analytical frameworks, incomplete data, or one that doesn’t mirror the true population distribution, makes it impossible to trust the story the data tells. That changed after our Series A. With new funding, we invested in data at scale: hundreds of millions of conversations streaming in monthly, worth millions of dollars annually. We went from sparsity to density, from a handful of records to oceans of data. That transformation forced us to redesign and optimize our entire codebase overnight even line by line, but we welcomed it. After all, we love data.
Storing and Parsing Hundreds of Millions of Conversations, Monthly
Inside the Data: Key Search
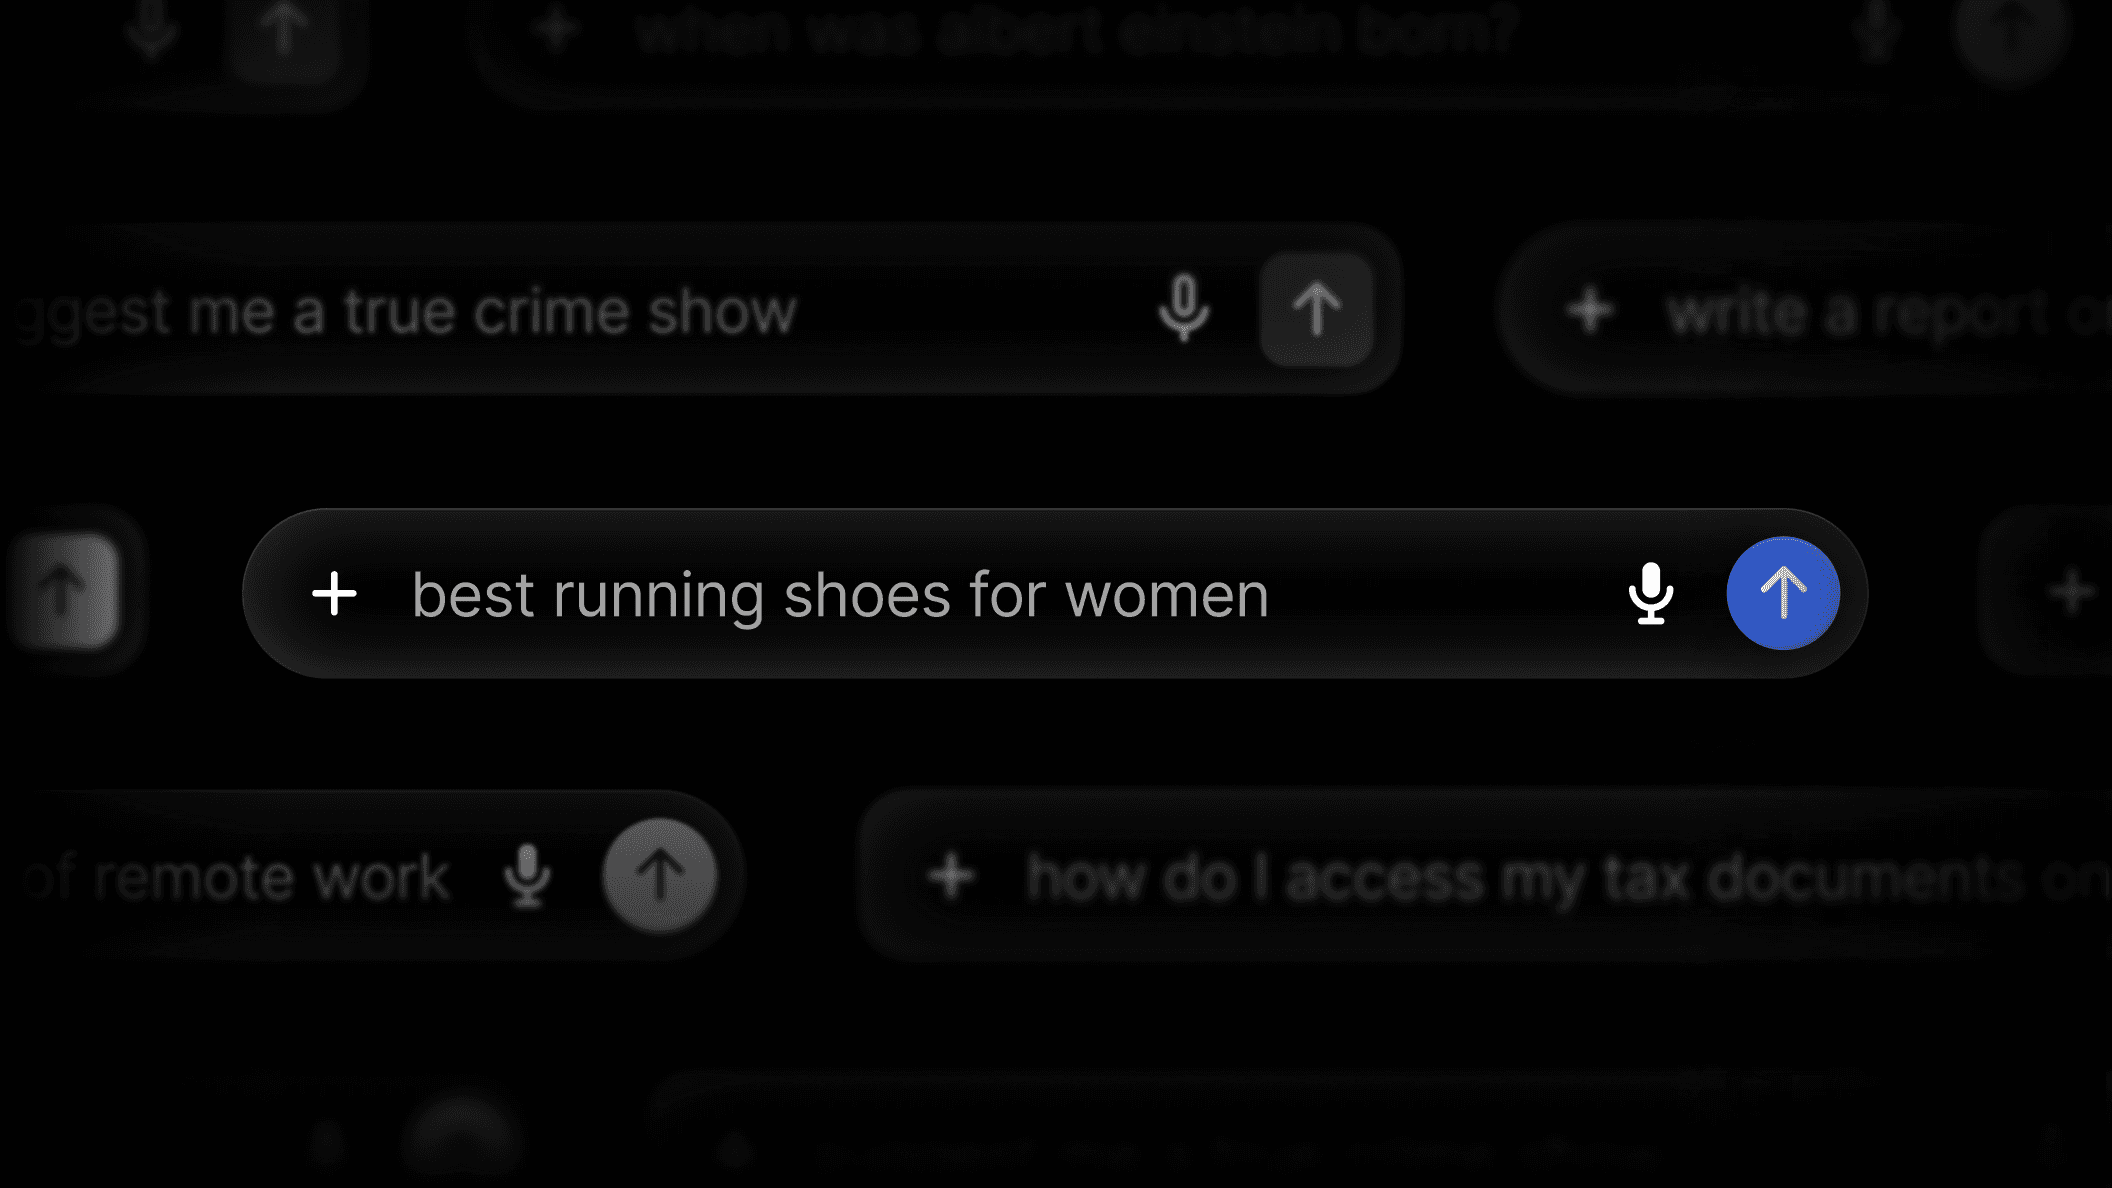
Before building semantic or intent models, the first thing to do was to analyze the words themselves. We began with large-scale keyword extraction and n-gram analysis - counting the occurrence of keywords across billions of real user conversations. This allowed us to quantify what people actually talk about, how often this changes and which topics were most popular, all in real-time (as our data constantly updates) and across hundreds of millions of different topics.
- We begin with extracting n-grams of various lengths to match common co-occurrences and combine this with efficient string search implementations. Regex-based search was too slow for our scale, so we experimented with the Aho-Corasick algorithm, an algorithm for multi-pattern string search, which is O(l + d) where l is the length of the corpus and d is the number of patterns.
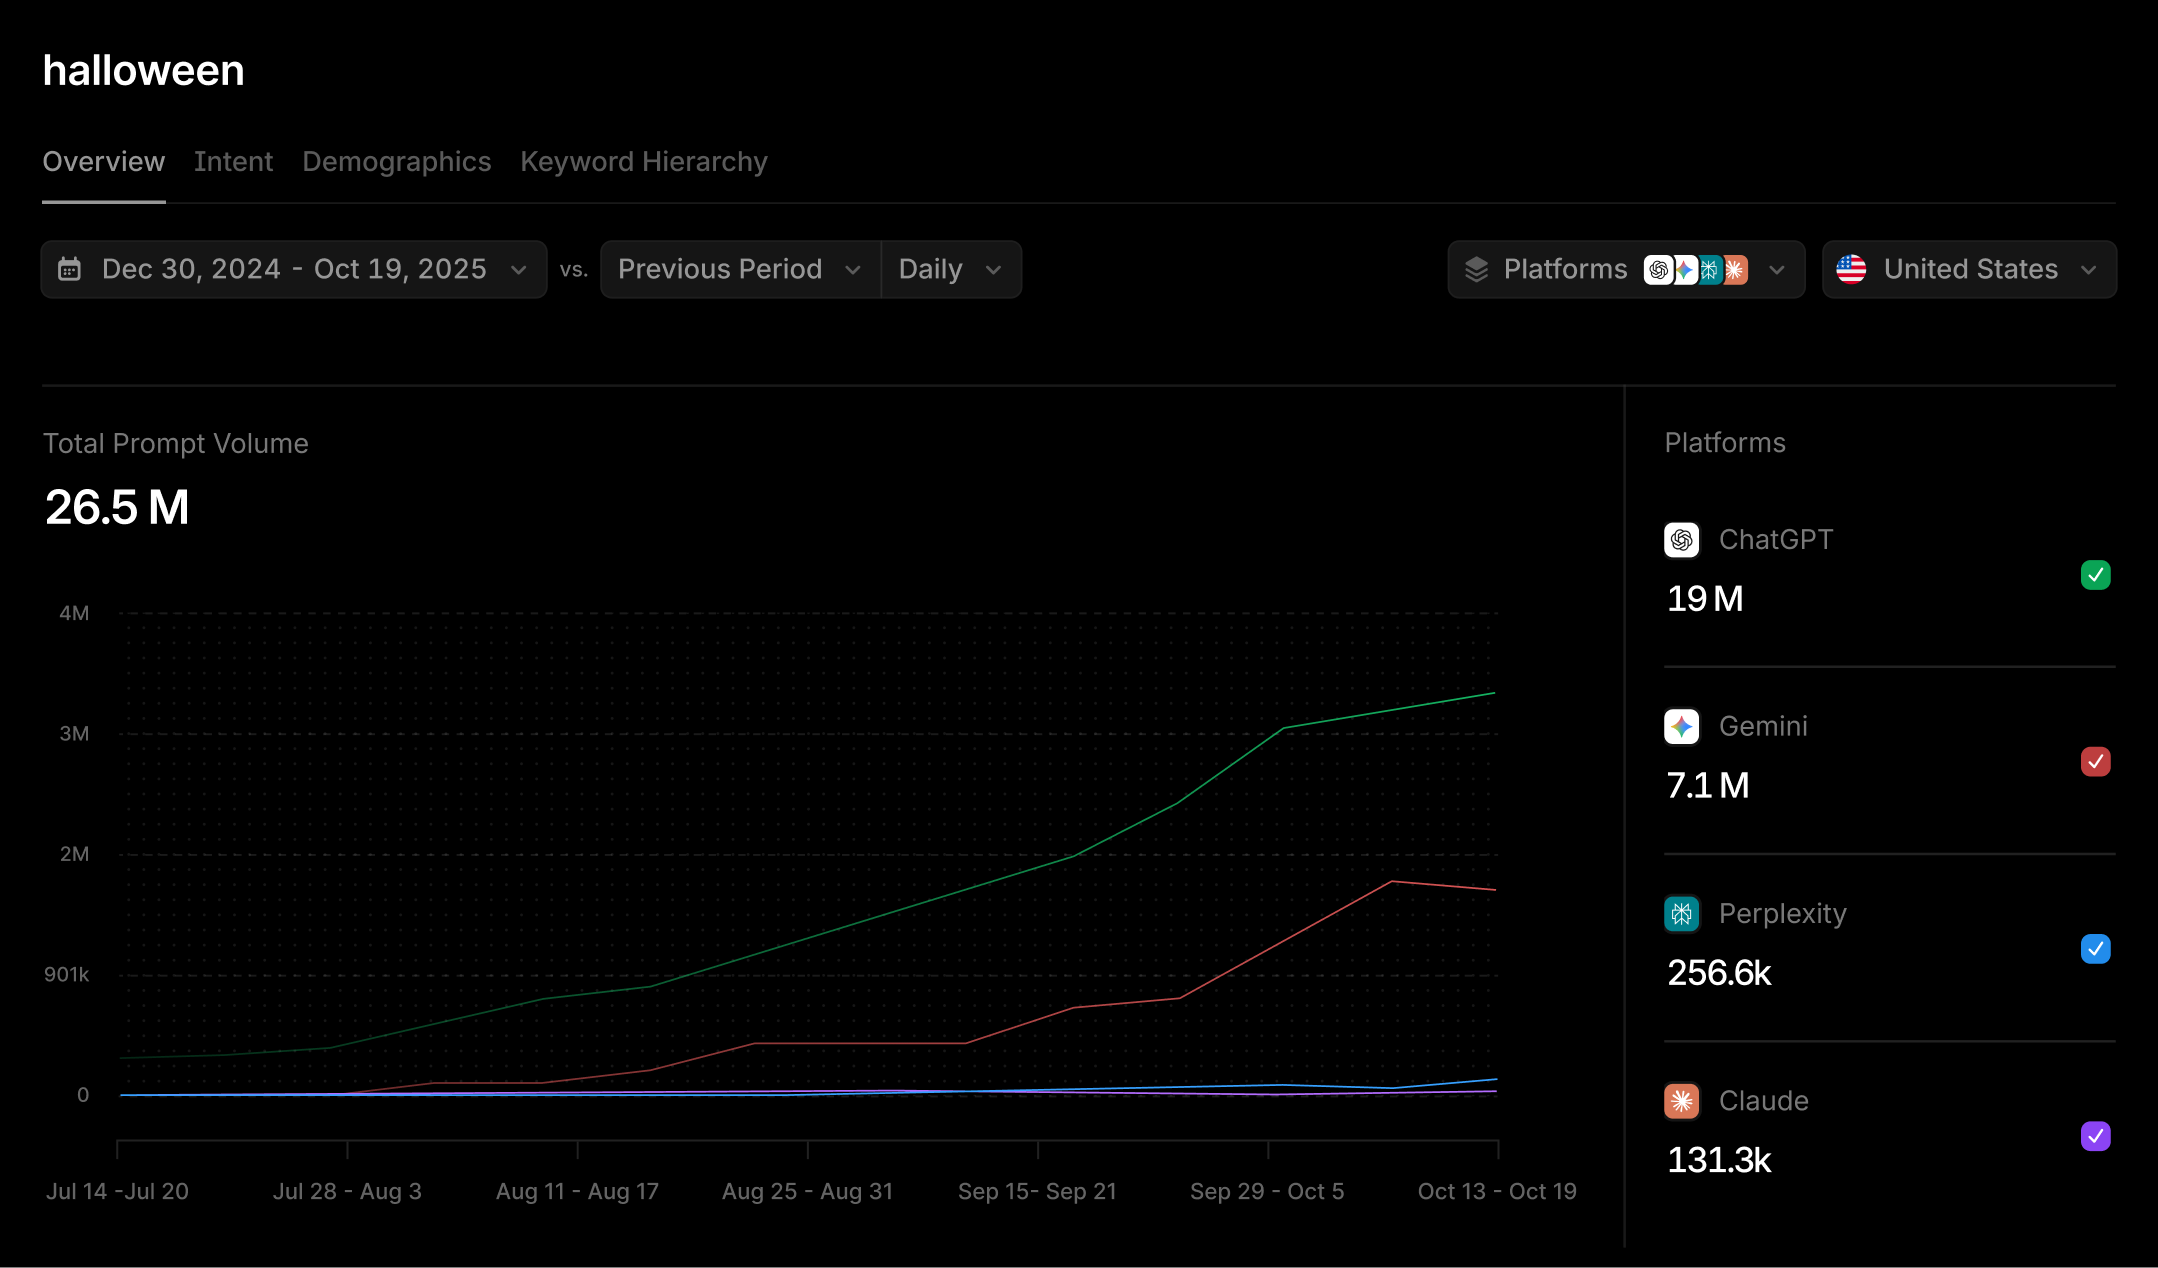
- By counting the occurrence of keywords in this way, we can see how interest in certain topics can spike or wane. This comes in the form of a volume projection (where we scale our panel to the global userbase).
- From there, we built a searchable database that serves thousands of requests with sub-second latency, allowing customers to query in real time across all of our topics.
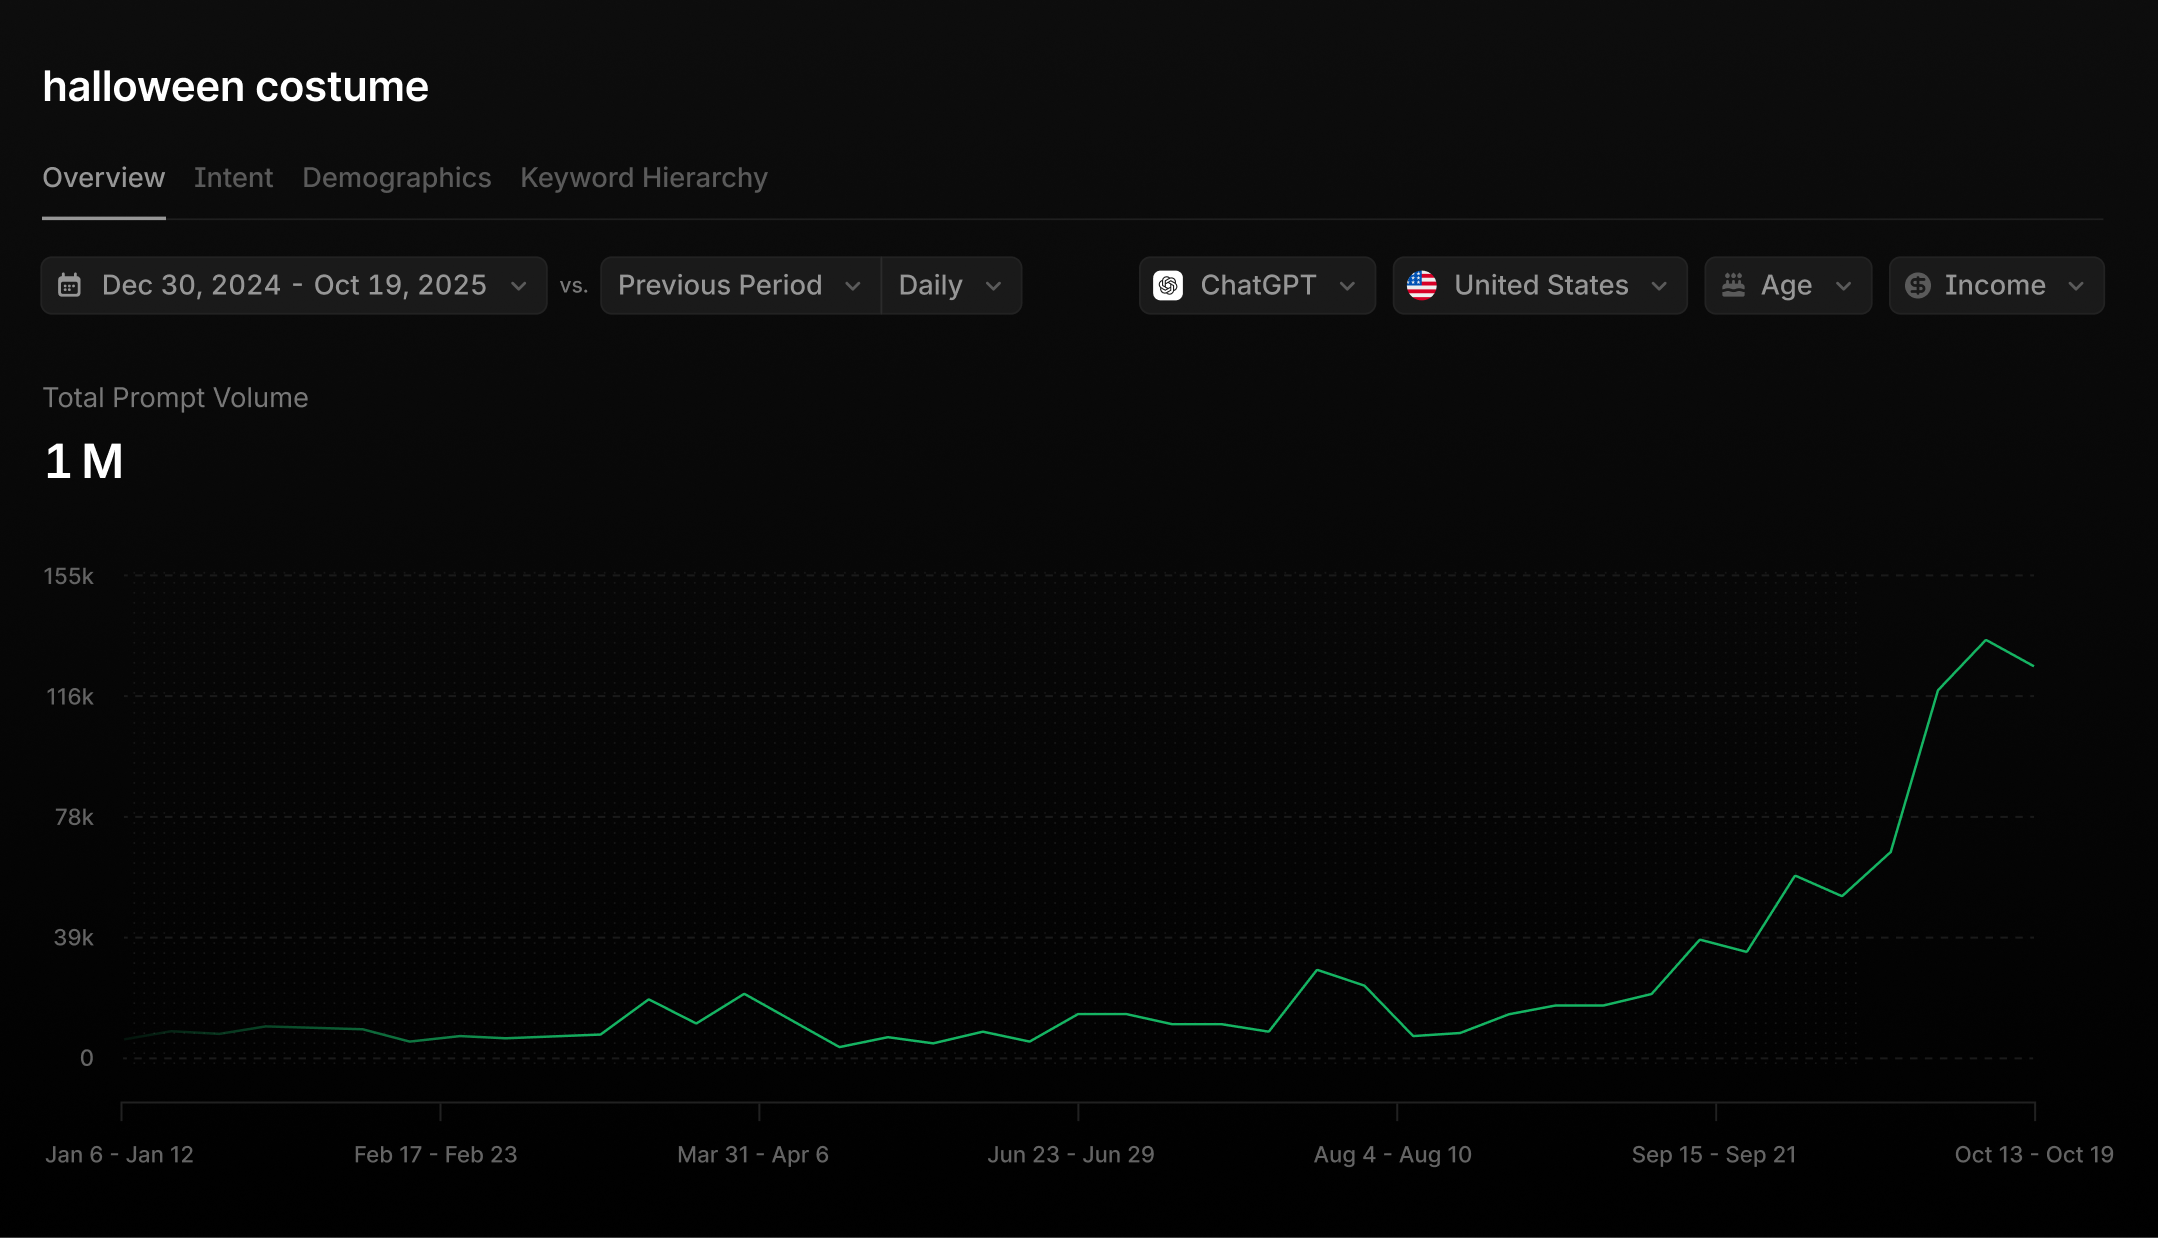
- Sometimes, a user will be interested in a topic that is outside of our pre-calculated set of topics. In these cases, our system will perform a live search across our entire database to compute projections on-the-fly for a completely new search topic.
This search layer became our backbone, an important first step in understanding our data, from which we can build more intricate analyses on top of.
Inside the Data: Semantic Search
While text-based search is a good first step it can only take us so far. Take for example, the word “car insurance” - wouldn’t match the query “I’m looking for auto coverage plans”. We still wanted to be able to surface these kinds of examples as well as match semantically relevant queries to given keywords, even if there was no immediate text match.
For this, we built our own RAG (Retrieval-Augmented Generation) pipeline, chunking and embedding each conversation and storing it in a vector database.
The pipeline works as follows:
- Chunking: Each chat thread is broken into context windows to prevent overly long conversations, with multiple themes to have their meanings blended. Windows are also overlapped to ensure information between chunks is not lost.
- Embedding: Each chunk is then embedded into a high-dimensional vector space which captures semantic meaning. We experimented with several embedding models for suitability.
- Storage: We index these embeddings in Milvus, while attaching important metadata for query-time filtering.
- Retrieval: Queries - when a user queries for a given topic, this is embedded in the same way and the vector database efficiently performs an approximate nearest neighbours algorithm to match this to conversation chunks based on semantic similarity.
- Reranking: While cosine similarity can act as a first filter, we often need to rerank our output to maximize relevance.
This semantic layer allows us to go far beyond “who asked about X.” We can now trace how users think about X, even when they never mention it directly.
Building a Classifier
With search and semantic layers in place, the next question became: why are people prompting? We wanted to categorize our conversations by intent (be it commercial, informational, generative and going further within these categories too). An immediate challenge was, while simple approaches (through public LLM APIs) would scale to hundreds of thousands or millions of conversations, scaling them further was infeasible both in terms and time and cost.
Furthermore, more traditional NLP classification approaches were not flexible enough for our needs - any given classification would have to be carefully tuned and would not generalize to other classifications. To optimize this then, we had to host language models with our own infrastructure with GPU-based inference clusters, allowing us very fine control over optimization parameters with maximal throughput. This setup was finally able to optimally tradeoff speed and generalizability.
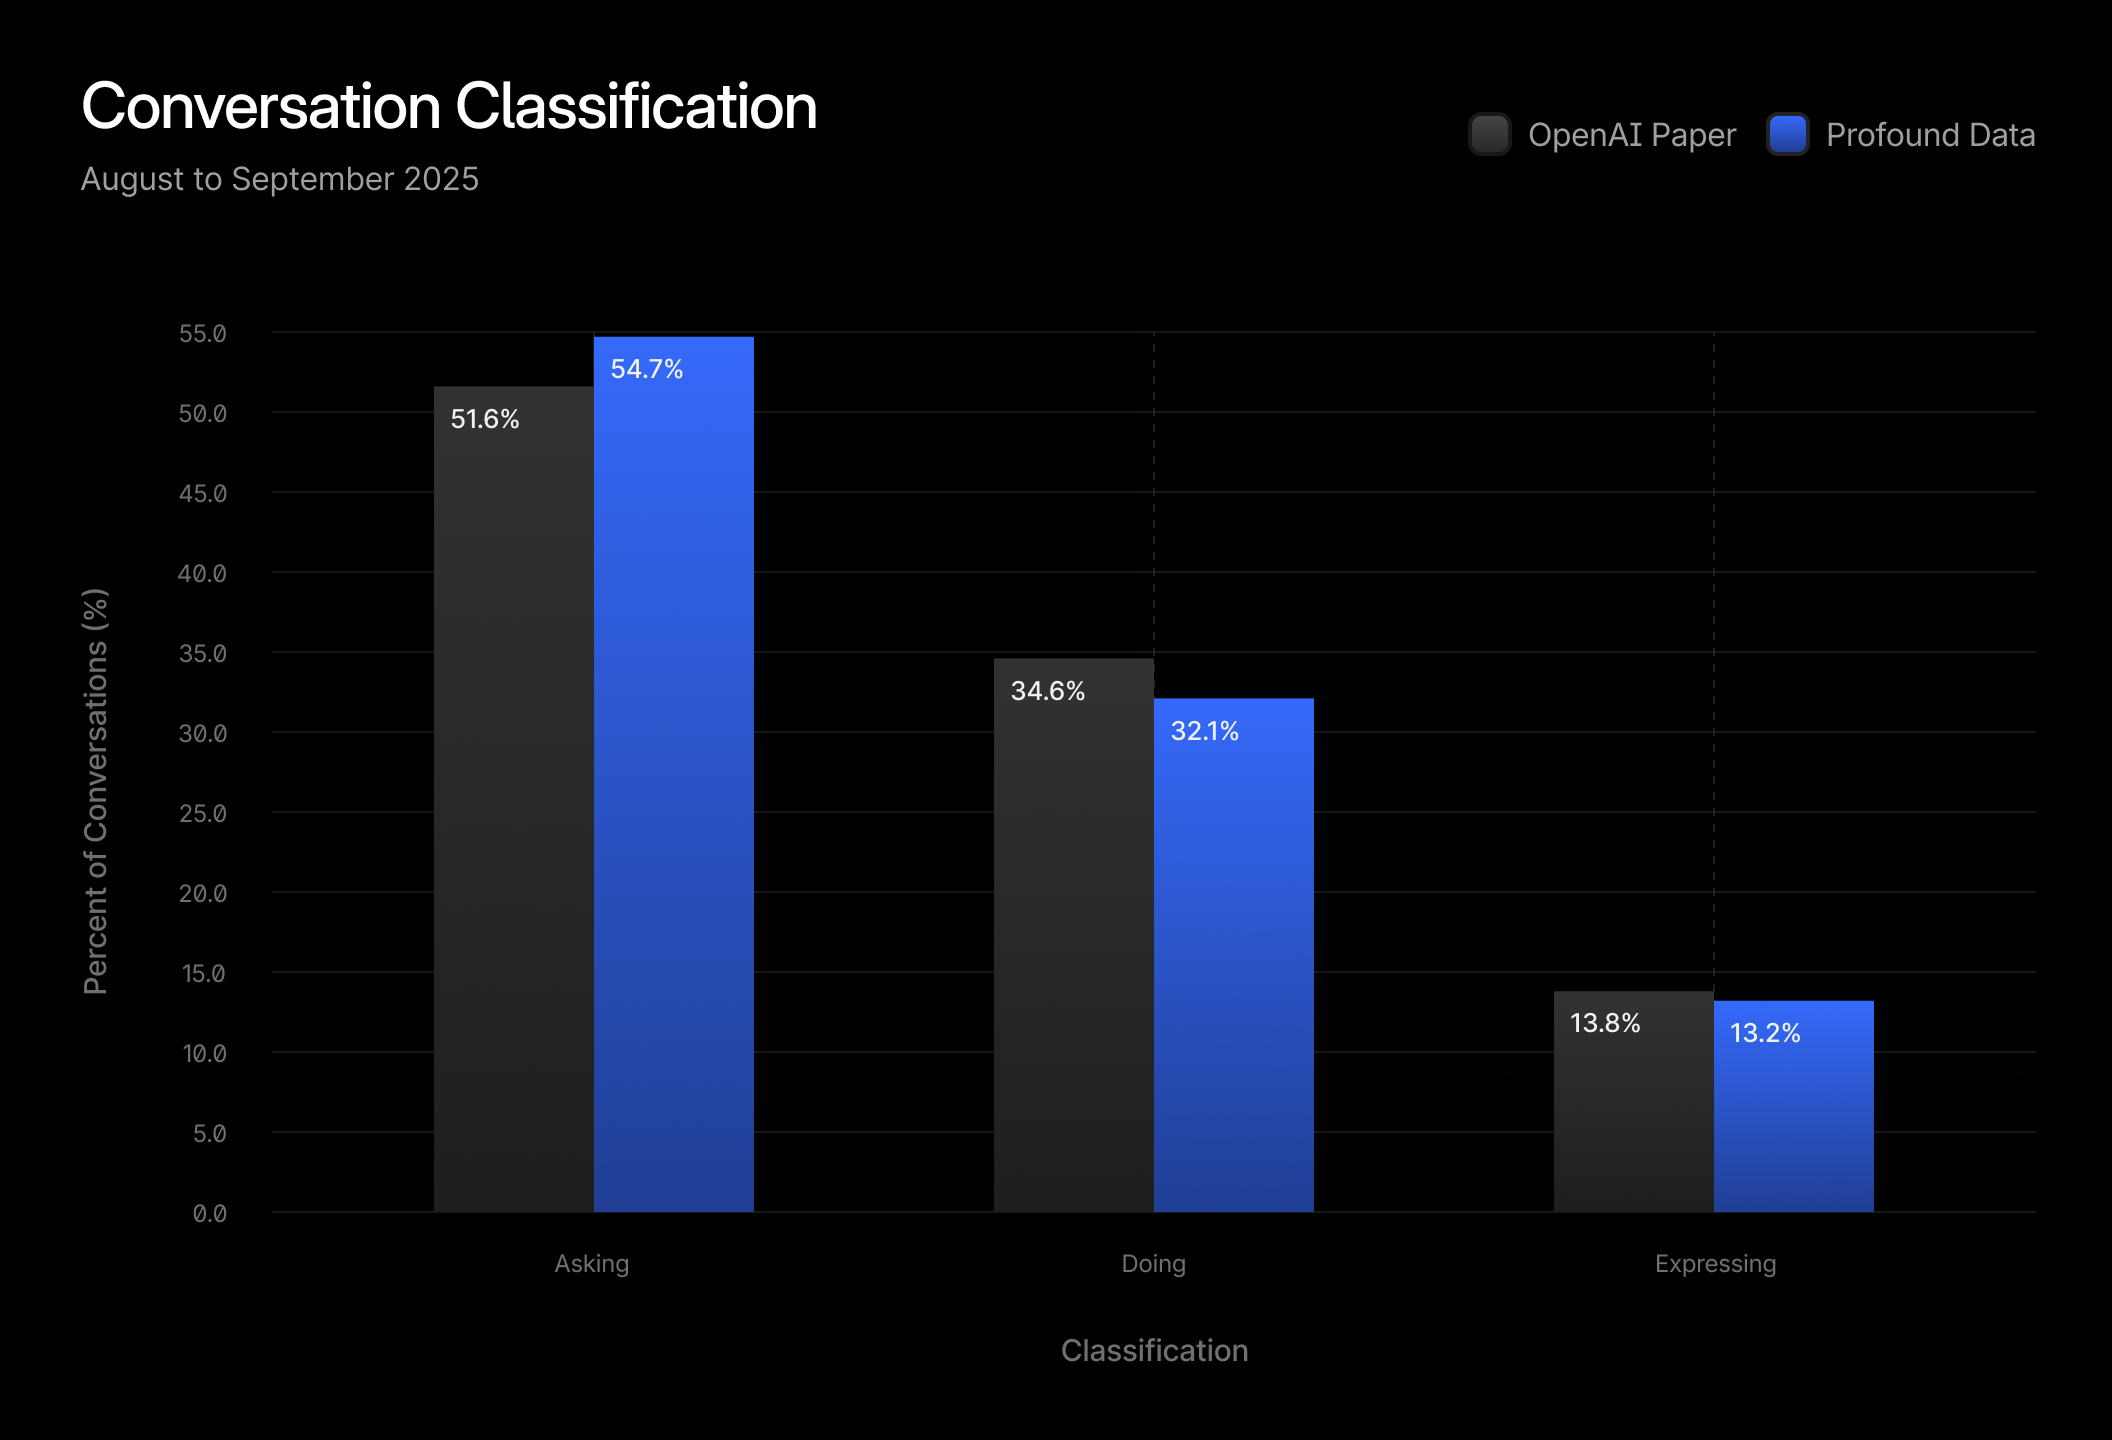
At the same time we were setting up this infrastructure, OpenAI released a paper How People Use ChatGPT where they used a very similar method in categorizing user conversations into various intent categories. Sometimes these were simple (e.g. is the user asking, doing, explaining, etc) but other times there were dozens of deeper level topics.
We knew immediately we had to replicate this result with our data, not just for curiosity, but for validation. When you work with third-party data, there’s always the risk that your panel lacks representativeness (even while trying to mitigate bias as much as possible): how can we know our data reflects the real world’s usage distribution?
The only way to confirm was to replicate known results. If our classifier reproduced the same distributions as OpenAI’s live data - across various intent types (which they defined), then we could trust that our underlying corpus’s distribution was indeed representative of the population. We used the same set of prompts as the original paper and applied them to our much larger dataset. The model achieved strong alignment with the reference distributions, confirming that our dataset mirrors real-world patterns. Here’s a simple example of a 3 category classification found in the paper.
This replication was more than a sanity check. The OpenAI paper captures the true production distribution of LLM usage, and by matching our results to it, we confirmed that third-party data reflects real-world patterns. That validation means our insights, and the analyses our customers rely on, are grounded in reality, giving clients confidence that shifts in prompts or topics reflect genuine user behavior, not data artifacts.
What’s Next
With the data we now have access to, not only could we replicate OpenAI’s paper on How People Use ChatGPT, but we could also write the same analysis on how people use Gemini, Claude, Perplexity, and more.
Ultimately, at Profound, we want to bridge research and product - to not only write a paper about a single point in time, but to observe how production data distribution evolves over time.
If you want to help us write papers of this kind and solve problems of this magnitude, come work with Sid and Ali on this.
We are hiring Data Scientists, Forward Deployed Engineers, AI/ML Engineers and Software Engineers, who love exploring data as much as we do, and more.