Reporting takes time. It always has. The data exists, the stakeholders want it, but pulling it together, applying filters, grabbing the right charts, formatting everything into something shareable, compounds every single week. We built Custom Dashboards to make it faster.
Custom Dashboards give you fully configurable, shareable views of your Profound data, without friction every time you need to check in.
Creating a Custom Dashboard
The new Dashboards section lives on the left nav alongside your existing Profound tools. From there, you can create as many dashboards as you need, configure them, and return to them exactly as you left them.
Here’s how it works:
Choose your visualizations
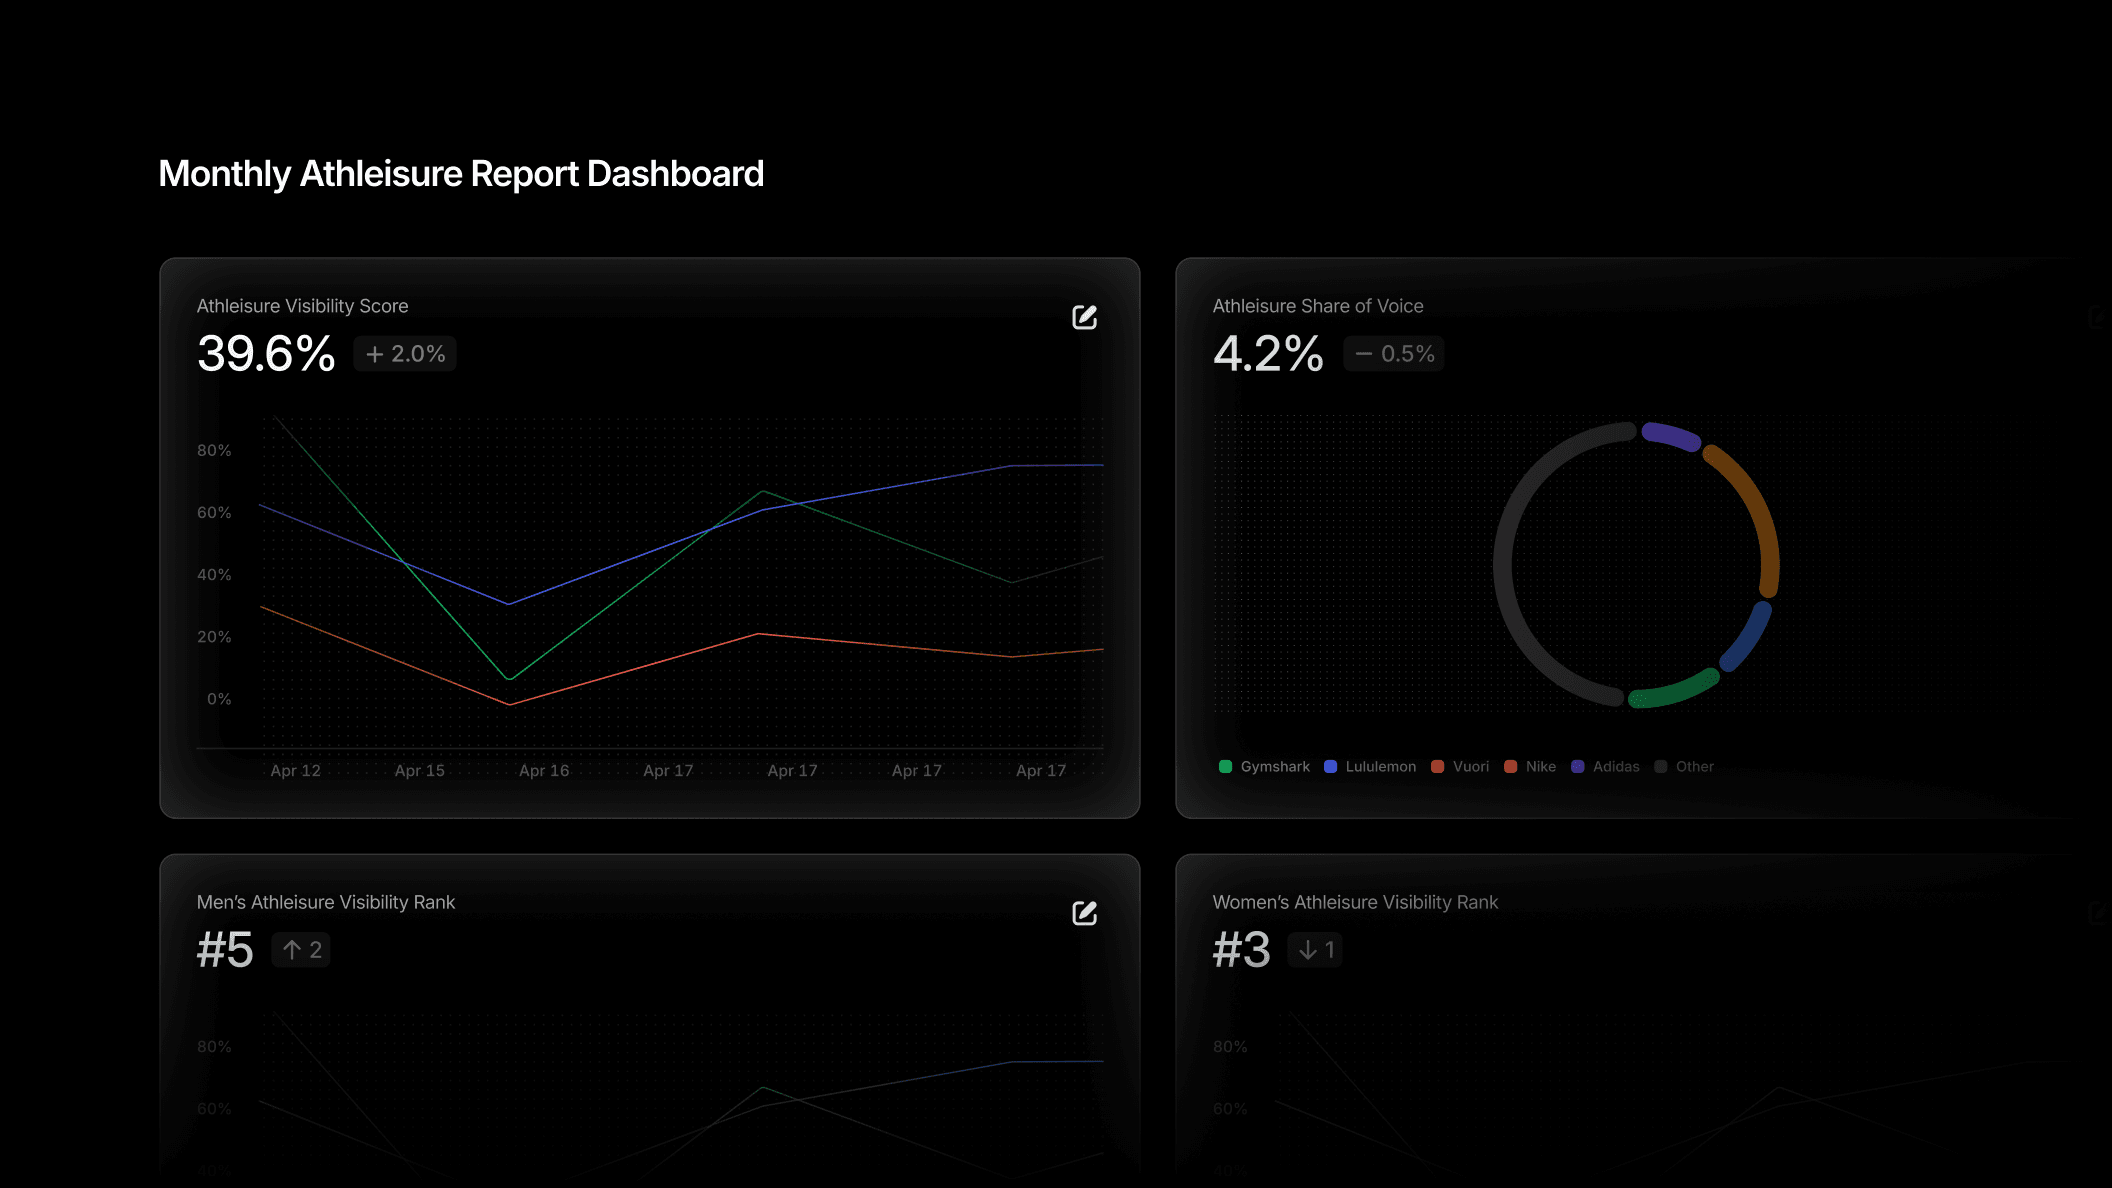
Pick from Profound's available chart types including Visibility Score, Share of Voice, Average Position, and Citation Rank. Add as many as you need and arrange them on your dashboard.
Apply filters
Filter the data based on Profound Topics, Tags, Platforms, Regions, and Personas. Then, save your filters for your next session.
Configure your dashboard
Filter your dashboard by specific date ranges, rearrange charts via drag-and-drop, and update your dashboard’s name any time you need.
Export as PDF
Export any dashboard or view as a PDF directly from Profound. No screenshots or tedious reformatting, but instead one click to produce a clean, shareable document.
How to use Custom Dashboards
Keep your top-line metrics always top of mind
Configure your dashboard to show the metrics that matter to you most across Visibility Score, Share of Voice, Average Position, and Citation Rank. Build a weekly or even daily rhythm of checking progress without having to dig.
Create weekly reporting without the thrash
If you're pulling the same visibility and citation data every week for a team sync, build a dashboard once and return to it with your charts arranged and filters set. Plus, if you are out on vacation one week, any Profound user can log in to see your dashboard and share the most up to date data.
Always on-reporting for leadership
When leadership asks for an AI Search update, and they will, you are ready with a fully configured dashboard. You can remove the last minute scramble when questions come up.
Easy cross-functional visibility
For teams sharing AEO data with partners who don't live in Profound day-to-day, dashboards give you a clean, reliable format to share out. Instead of having to grant access or take screenshots, you can export in one click.
Get started
Custom Dashboards are available today for all Profound users. Get a demo here. If you'd like to explore our other product updates check out our blog here.