
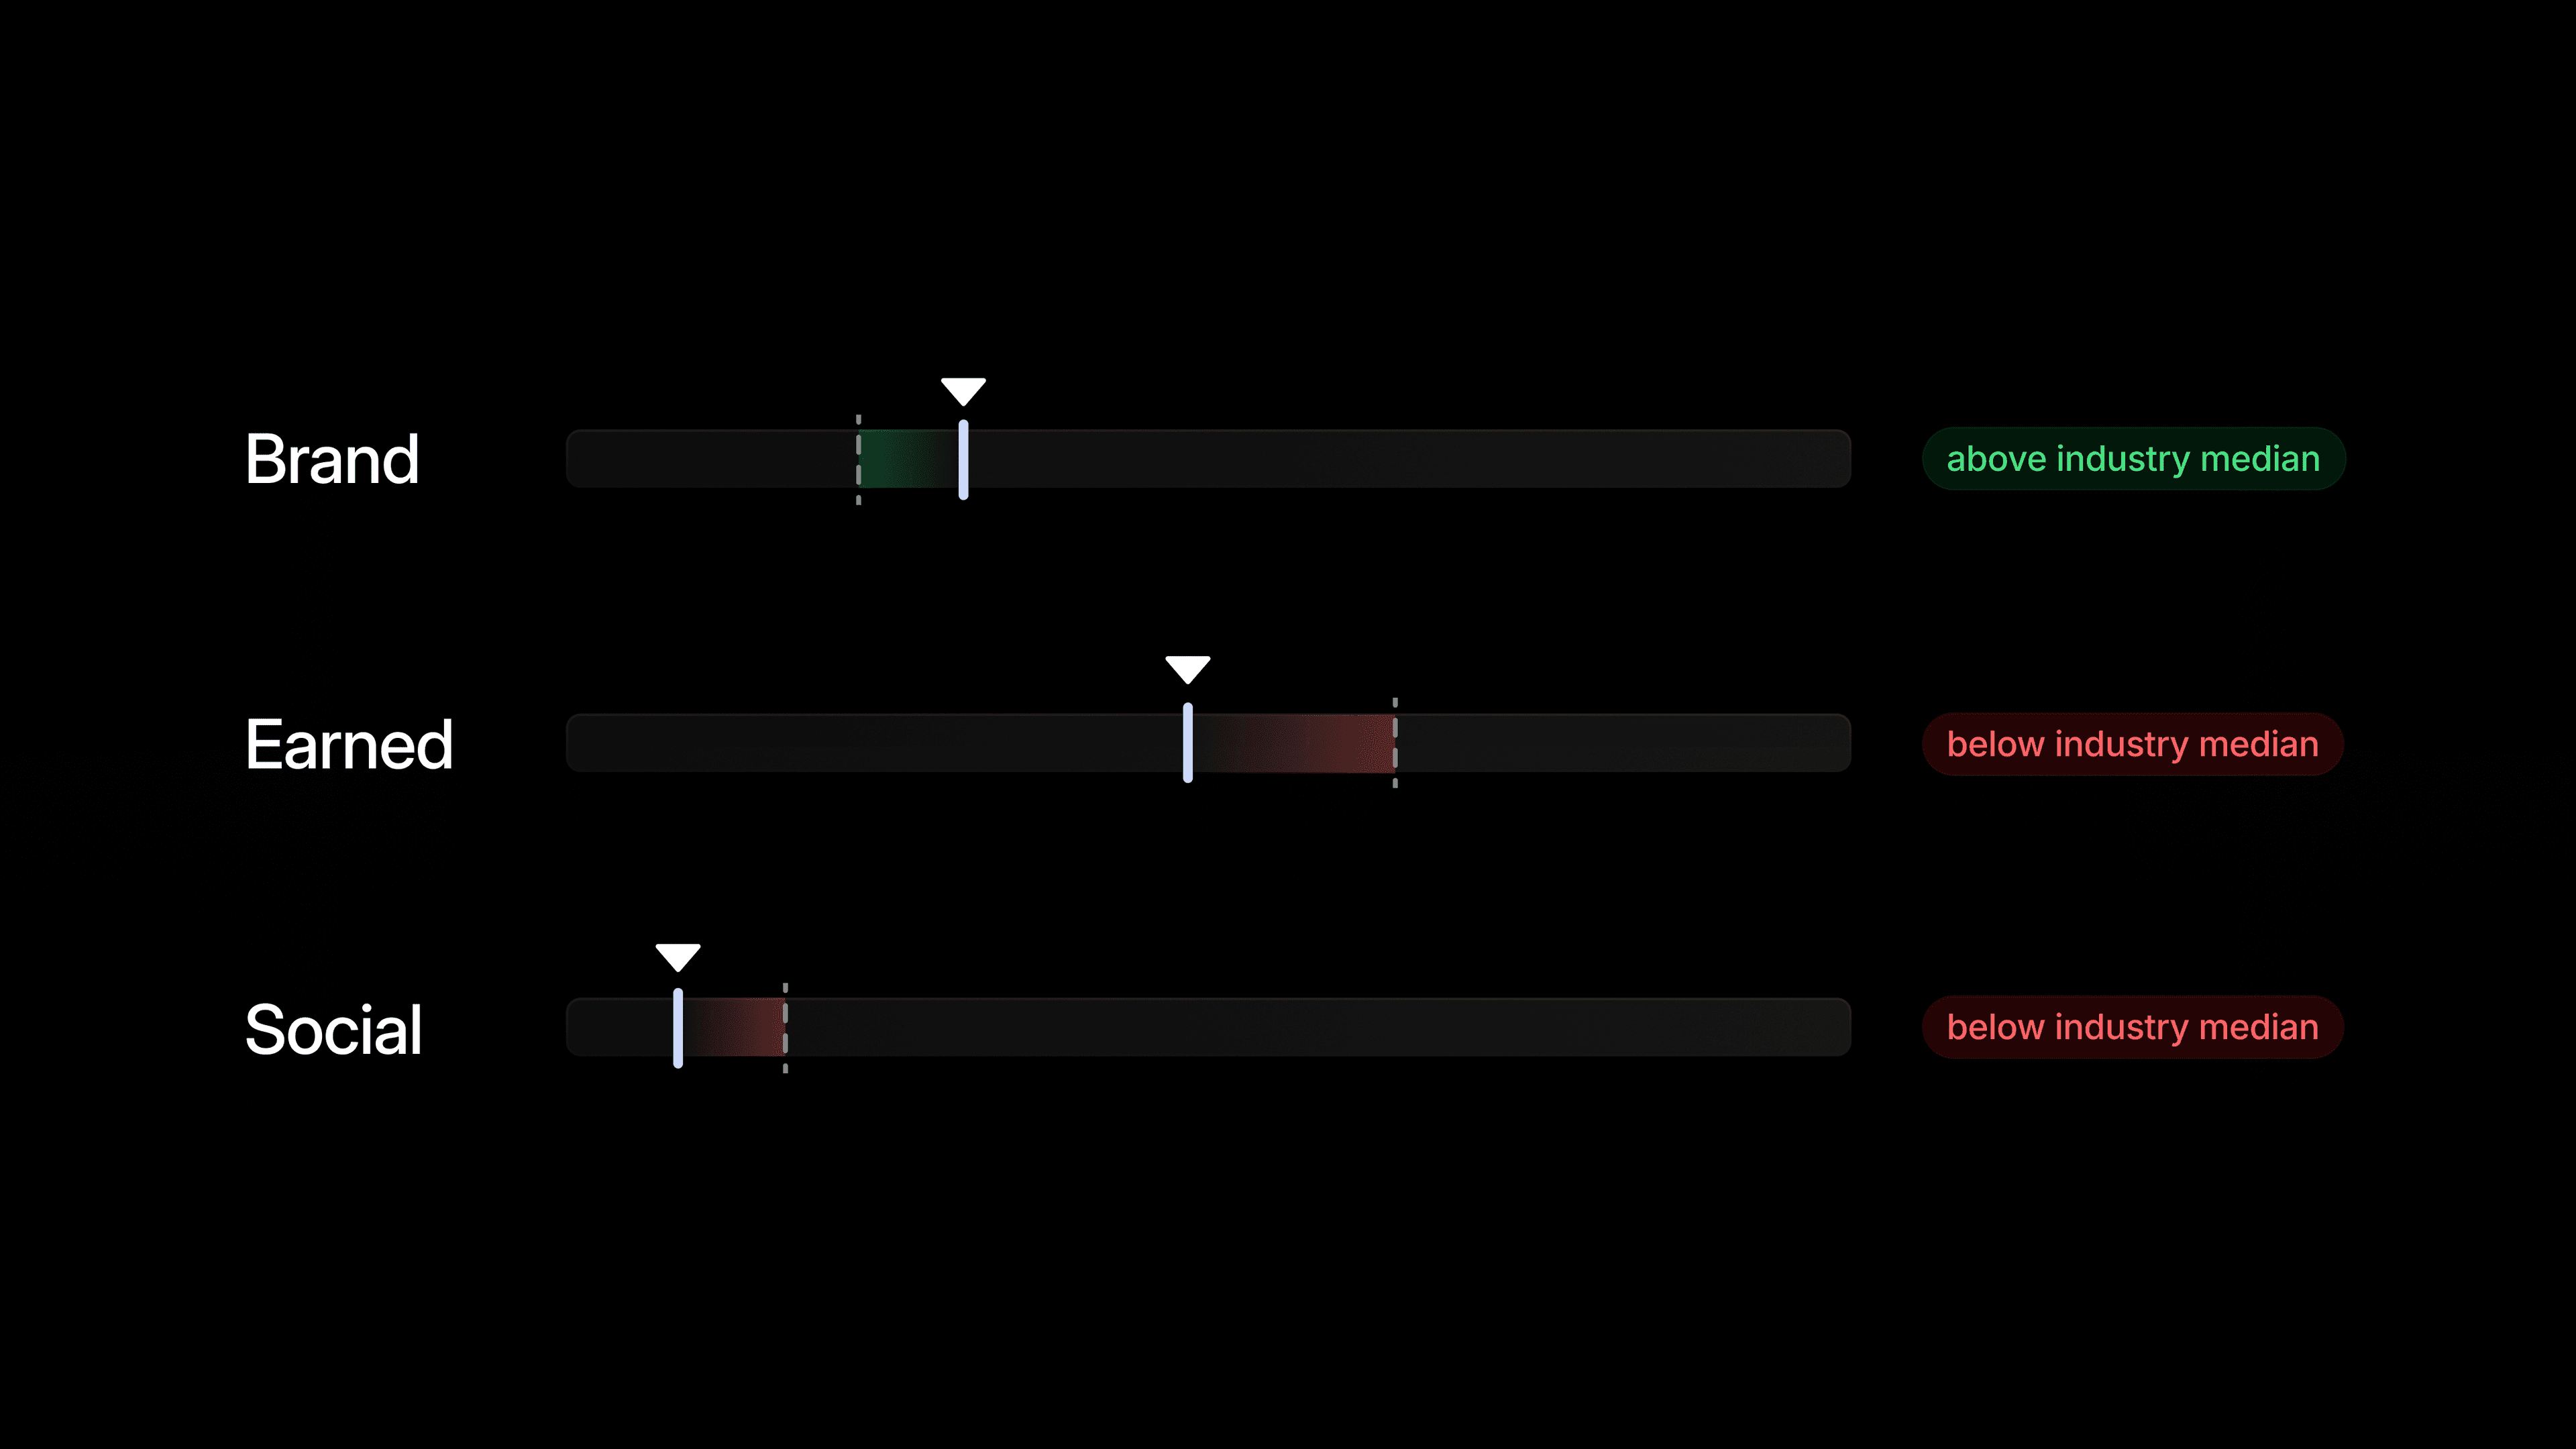
AI writes its answers from company websites. The question is whose.
TL;DR
- Understand your citation mix relative to your industry. Every industry is different: some industries like pharma see only 33% of all citations come from brand media, while others like marketing are far more reliant on it, at 72% of all citations. Improving your standing relies on understanding your blind spots.
- Identify which citation buckets (earned, brand, social) drive your industry.
- Publish or partner with content publishers who can help shift the citation mix in your favor, dependent on where your gaps may be relative to the broader industry. For some industries, like fashion, social media may be the right lever to optimize against given it drives 16.5% of all citations on median. Yet a YouTube strategy is likely not a top priority for pharma, where social media only drives 5% of all citations.
How do I outperform my peers?
This is a flavor of a question we get often at Profound, and it's not a bad question, but perhaps it's the wrong one. The first step to understanding how AI can be influenced is to understand where AI sources information. In other words, a better starting place is: how does AI source information for my brand and how does that compare to my competitors'?
We looked at 11.8 billion citations across 29 distinct industries and 8 models to understand how our customers are being cited and how they stacked up to the trends affecting their broader industries.
What we found to be the case systematically was that the biggest source of AI citations isn't the press or Reddit or YouTube; rather, it is a long tail of company websites.
We looked at 29 industries and in 24 of them, the median Profound customer gets more citations from brand sites (competitors, adjacent companies, etc.) than any other bucket across brand, earned, and social. Globally across all models, AI citations are roughly 57% brand citations, meaning more than 1 in 2 citations is a brand site. We define a brand site as one where the citation lives on a company's own website: corporate sites, product sites, brand-owned blogs and docs, etc.
Answer engines, however, are not monolithic; each one leans on different sources of information to inform responses. ChatGPT uses brand sites the least of all the major answer engines at 47% of all citations, but Google Gemini, on the other hand, loves them. 69% of all citations on Gemini are brand sites.
This is all just the first layer of the onion. If we add an industry layering to the analysis, the citation composition changes even more.
Across all models, the most brand-media heavy industry, cybersecurity, tops out at a 74% median brand-citation share. The least brand-reliant industry, government and nonprofit, sits drastically lower at only 15.9% of citations being made of brand sites.
This changes how to think about AI search. Building owned content is certainly one useful lever for AEO, but without an understanding of how different models lean on earned or social vs. brand media, we risk missing the forest for the trees.
The question for the modern marketer is no longer how much earned or social matters for AEO, but rather which third-party surfaces matter most for your industry and the models you need to show up in.
Citation-mix is different for every industry
Why does the citation-mix differ by industry?
All industries have different best practices for content marketing. This content supply chain, among other things, has downstream effects on the available information that ChatGPT and Google consume to form their own opinions and answer user prompts.
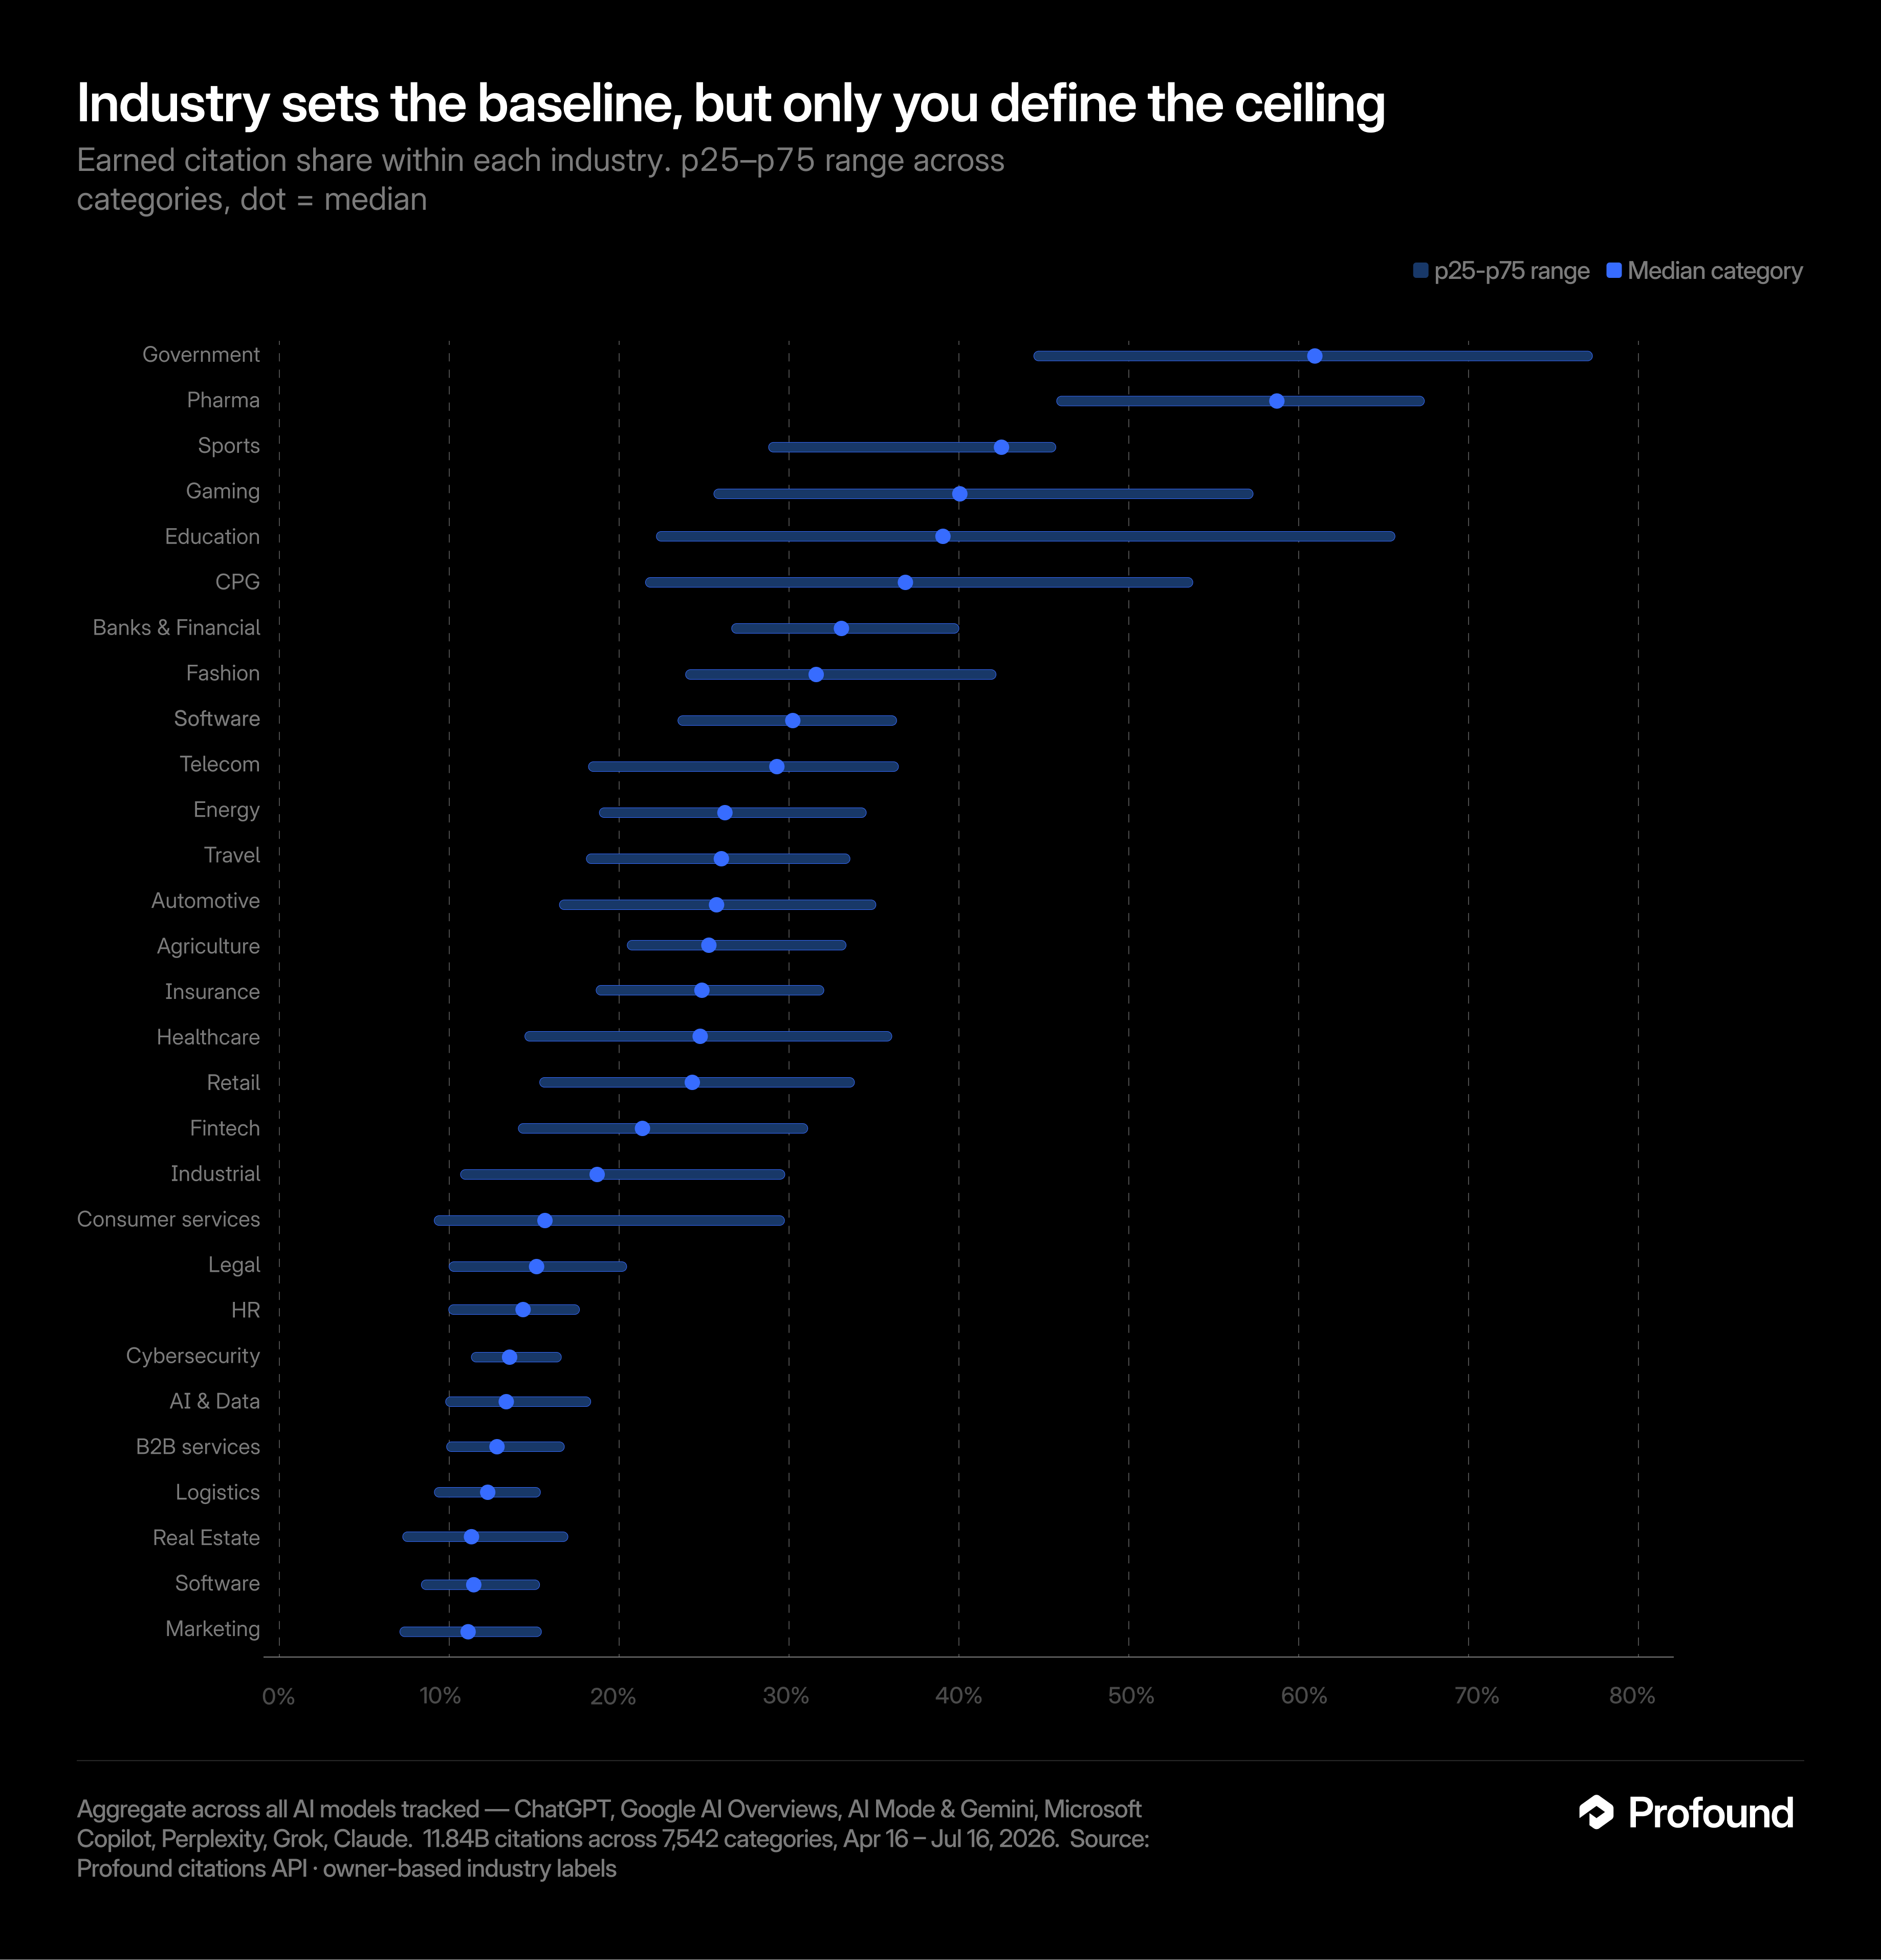
Earned media reliance, defined as the percentage of all citations that come from earned media sources, materially shifts between industries.
For example, pharma and biotech companies see, on median, 59% of all citations come from earned media. This intuitively makes sense; pharma companies often face more scrutiny on their claims from both a health and compliance perspective. Content creation, in the context of larger pharma companies, is a multi-party negotiation between policy, legal, communications, marketing, and editorial teams. This creates friction to content creation for owned media sites, making it easier in practice to partner with earned media publishers for online presence.
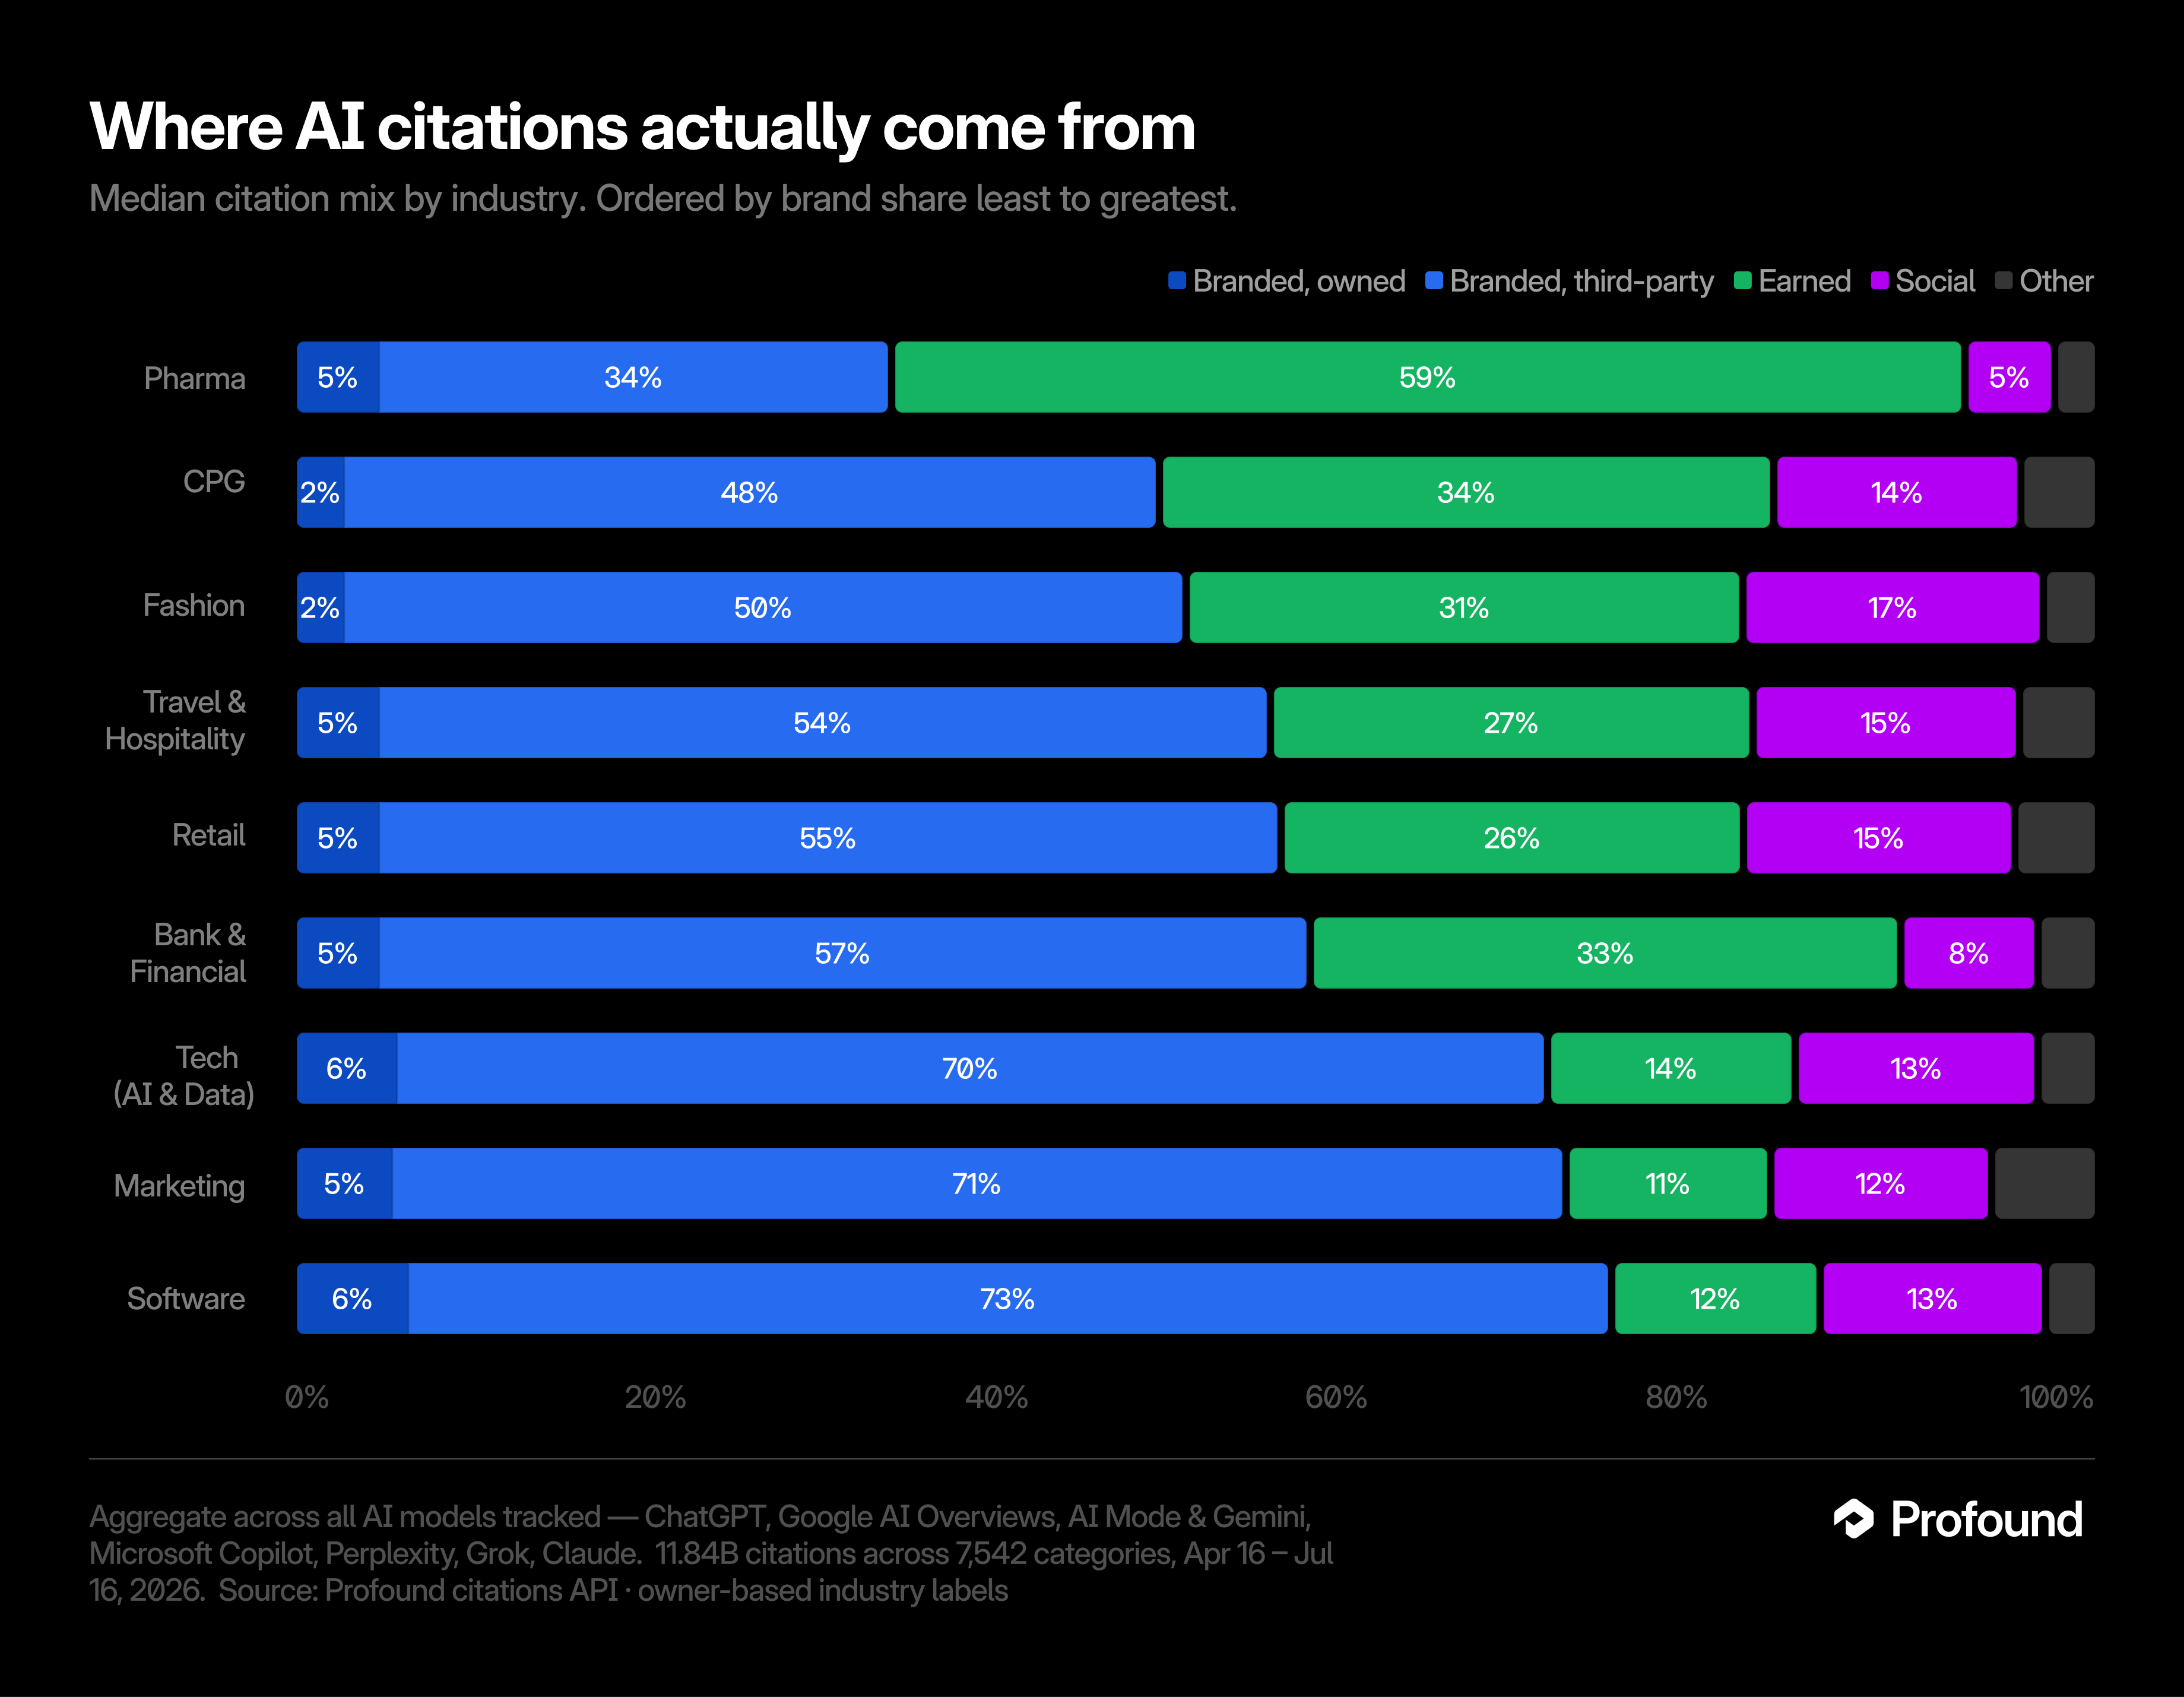
This preference holds true across all models (pharma has the highest share of earned media citations for every consumer model across ChatGPT, Microsoft Copilot, Perplexity, Google Gemini, and Google AI Overviews).
SaaS and software companies, however, are the polar opposite. These companies, on median, only see 11.4% of their citations come from earned media across all platforms.
The difference in industry citation norms is, in part, a function of the web's content supply, along with AI's distinct retrieval preferences by model.
Optimizing your performance on earned, brand, or social media is a function of understanding:
- Industry-level citation norms
- Your specific gaps relative to broader performance in each of those buckets
Where the information comes from depends on which model answers
Each consumer LLM has access to a different universe of information. ChatGPT has invested tens of millions of dollars in data licensing agreements with companies like Reddit, allowing it to train and search on this universe of data, where Anthropic has not brokered similar agreements. Google has also committed significant resources to data partnerships in kind. LLMs cannot cite what they cannot see, and every major consumer platform has its own quirks, which is why optimizing for Claude or ChatGPT or Google AI Overviews all require distinct strategies.
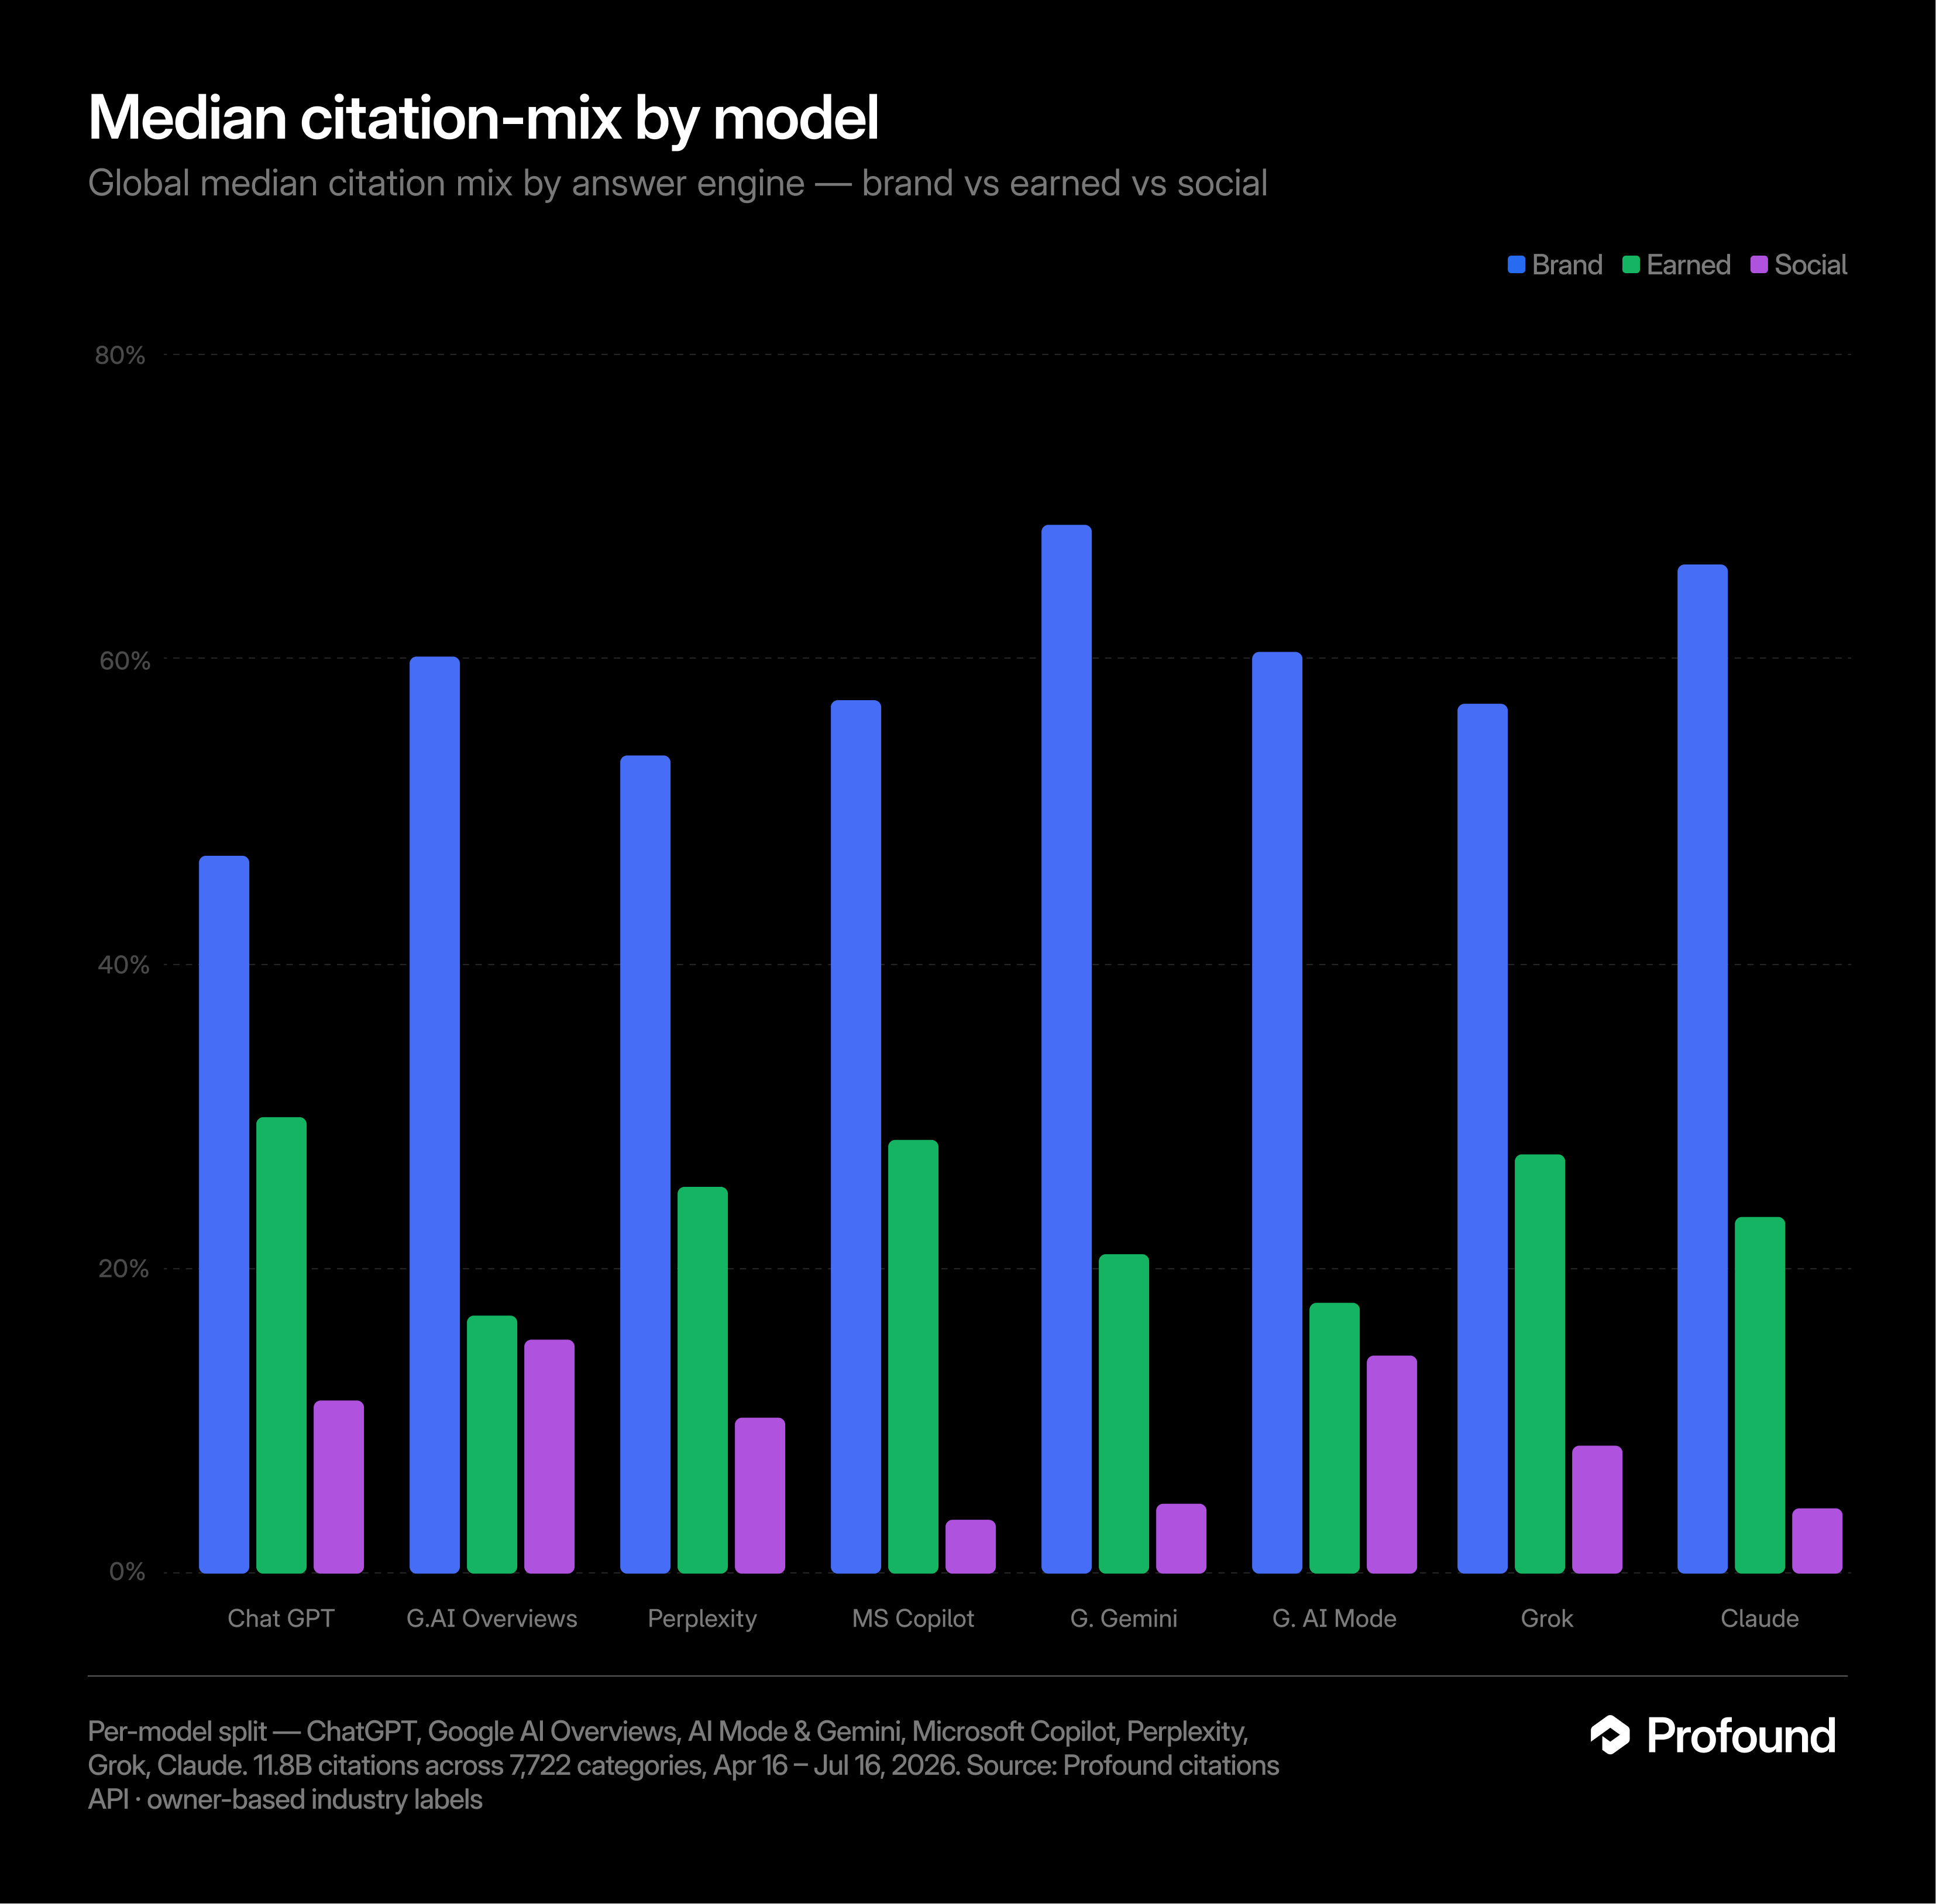
Relative to other models, ChatGPT's universe is most heavily made of earned media at 30% of all citations, whereas Google AI Overviews is the lowest on earned media at 17.0% of all citations on median.
Google loves social citations. AI Overviews (15.3%) and AI Mode (14.4%) cite social at roughly 1.3× ChatGPT's rate and 4× Copilot's. If you ask about fashion brands on AI Overviews, you'll find that approximately 1 in 4 citations is a social source. On the other hand, Copilot basically makes a brand's social presence feel invisible. Only 1 in about 29 citations is a social source.
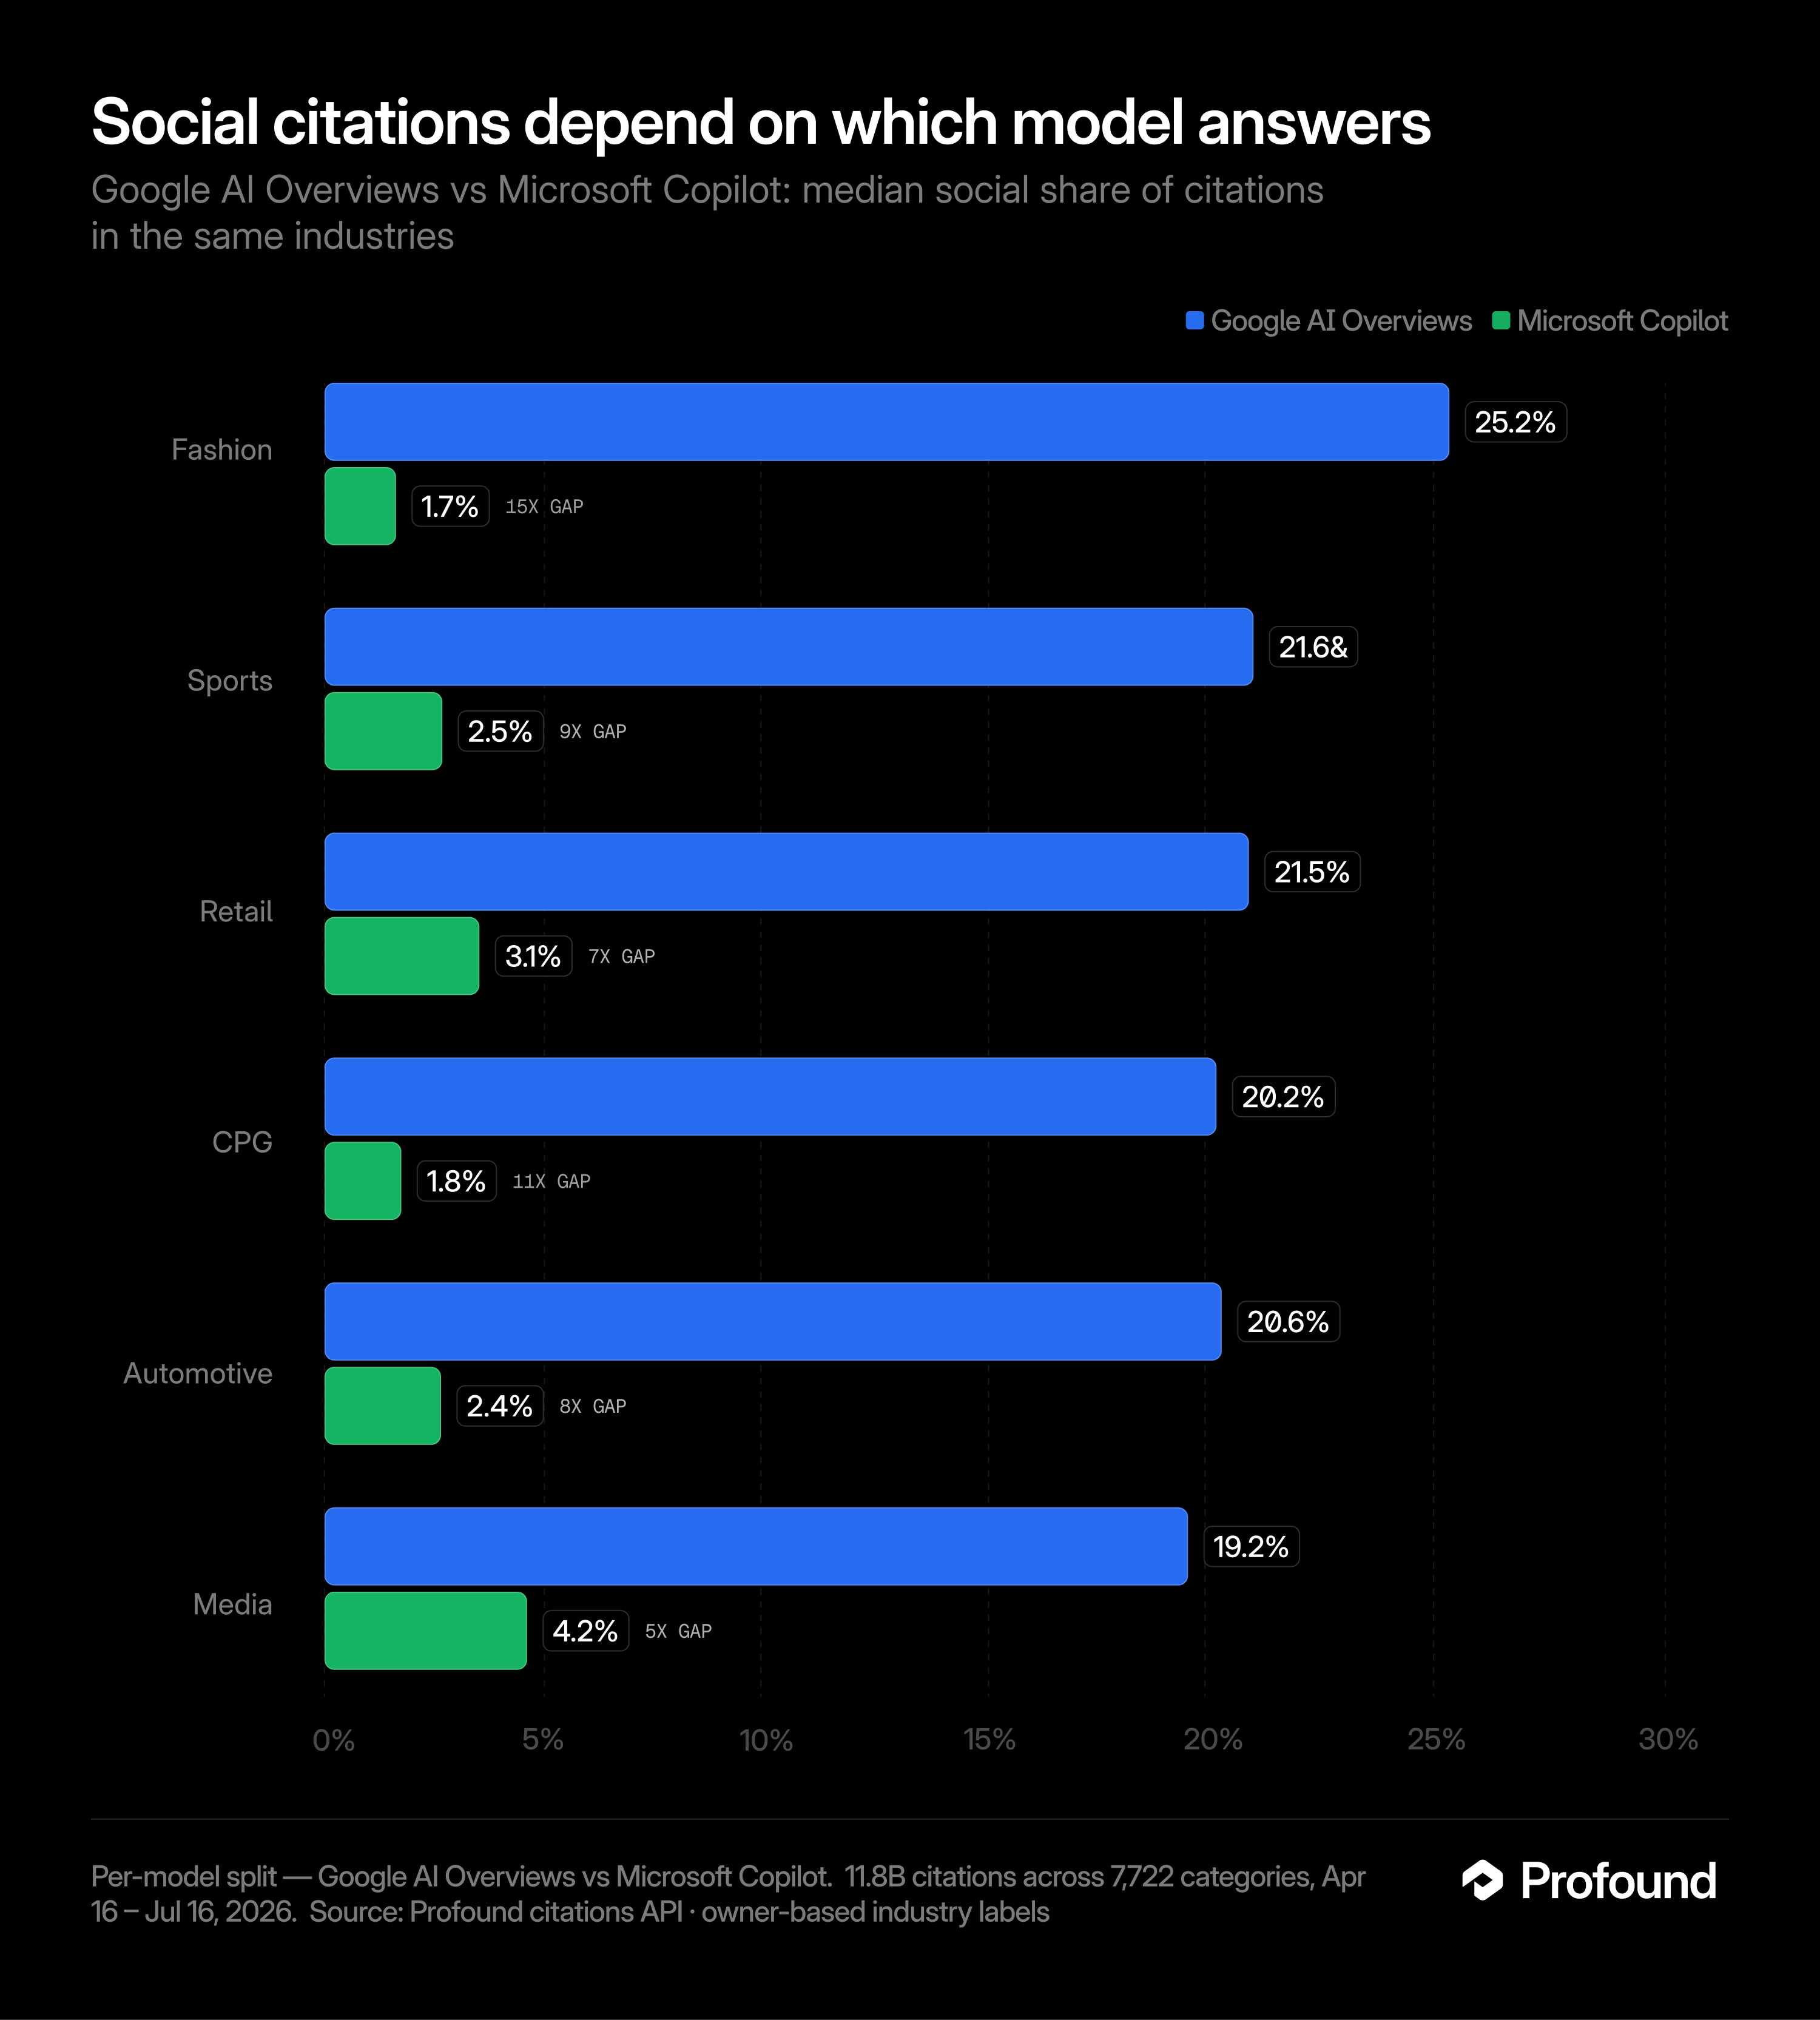
These model-specific differences are more fundamental than just distinct search preferences. They're also a question of data access.
What does this mean for marketers?
Your industry sets the baseline for comparison. It does not, however, determine your ceiling.
Even within the same industry, the spread between the earned-media share of a 75th percentile company and a 25th percentile company can be as great as 43 percentage points. Your company is distinct from the category you belong to, but comps can help ground your initiatives in realistic upside scenarios. In other words, industry-level citation benchmarks tell us how much room there is to change your citation mix to be more in line with others in your field.
As an example, if you're a pharma brand with 30% earned-media share of citations, the implication may be that you have a lot of ground to cover relative to the median 59% earned citation share. But if you're a fintech brand with 30% earned share relative to the industry median of 15%, you're already outperforming your competitors. A higher earned media share means more room to influence the LLM response for prompts you care about, with less room for competitive voices.
Understanding your potential for outperformance is, in part, a function of understanding the citation mix for your peer set of companies.
Methodology
To support this analysis we used 11.84 billion citations across ChatGPT, Claude, Google AI Mode, Google AI Overviews, Google Gemini, Grok, Microsoft Copilot, and Perplexity, spanning 8,061 active Profound categories swept between April 16 and July 16, 2026, of which 7,542 categories had at least 100 citations. Source: Profound citations API.
Every cited hostname was normalized to its registrable domain and matched against a classification map of 3.02 million domains, covering 98.3% of all global citation volume. Citations roll up into three buckets: brand (company-operated web properties of any company, not only the category owner's), earned (third-party editorial coverage, institutional sources, and PR wire), and social (social and UGC platforms such as Reddit and YouTube). The remainder (“other” plus unmapped long-tail domains) totals 2% to 7% per industry. The domain map is point-in-time; domains created or reclassified after the map date fall to unmapped or carry stale labels.
Each category is assigned an industry based on its owner organization via an LLM judge, classified into 29 industries. All medians and percentiles are computed over categories, with each category weighted once regardless of citation volume, so high-volume brands do not dominate industry-level figures. Per-model splits use the same category set, filtered to citations produced by that model; per-model cells require at least 100 citations and per-model industry rows require at least 30 cells.
This analysis is limited to an observational understanding of citation preferences by model and industry, but does not account for differences along the dimensions of region, language, or other demographic factors that may also influence citation preferences.
Get started
Want to see the citation-mix for the prompts that matter most to your brand, benchmarked against your industry? Get a demo.


