
Introduction
Profound helps brands see how they show up in AI answers: how often they get mentioned, and how much their own content shapes what the model says. To build that picture, we run a portfolio of prompts against each AI platform once a day, every day, and track how the numbers move over time.
That once-a-day cadence prompts a reasonable question from customers: why only once? Ask any AI model the same thing twice and you’ll often get two different answers. So wouldn’t running each prompt 10 or 100 times a day give a sharper, more trustworthy reading?
It’s a fair question, and we ran the experiment to answer it. The short version: for almost every case, once a day is enough. Here’s the longer version, and the data behind it.
TL;DR
- Once a day already lands within about 2 percentage points of a 10×-a-day reading for visibility. Running ten times improves precision by only about 10%.
- Citation share is the one place extra runs help a little. Ten runs a day cut the day-to-day noise by roughly 40%, but even then, a substantial share of the movement comes from the platforms themselves changing.
- You can’t measure your way past drift. The AI platforms update their models, prompts, and infrastructure constantly. That underlying movement sets a floor on precision that no amount of same-day repetition can beat. Once-a-day tracking already sits close to that floor.
- Which prompts you track matters more than how often you run them, especially for citation share.
What we’re measuring
Two numbers anchor our reports:
Visibility — how often your brand gets mentioned. Out of all the prompts we track, what share return an answer that names you. If we track 100 prompts and your brand shows up in 40 of the answers, your visibility is 40%. What “visibility” means in practice depends on which prompts you’re tracking and why: a portfolio built around one product line tells you something different from one built around a whole category.
Citation share — how much your own content is doing the talking. When an AI answer cites sources, what fraction of those citations point back to your owned domains and media. It’s a measure of how much you’re shaping the answer, not just appearing in it.
Everything below applies to both. For this analysis we treat each combination of portfolio, platform, region, and persona as its own separate measurement and look at the noise across every combination (think of it as a worst-case estimate of how much the numbers bounce around).
Why the numbers move
Before asking how often to measure, it helps to know why a measurement moves in the first place. If AI answers were fixed, you’d run each prompt once, ever, and be done. They’re not. Three different forces push the numbers around:
Same-day randomness. Ask a model the exact same question, in the exact same conditions, and you still won’t get an identical answer every time because LLMs generate text probabilistically. This is pure randomness, and it’s the kind of noise that averages away: run more prompts, or run them more often, and it shrinks.
Phrasing sensitivity. Reword a prompt and the answer changes. That’s not a glitch; the model is genuinely responding to a different question. It means the specific wording you choose is a real ingredient in your results, so prompts should be chosen deliberately.
Platform drift. The ground truth itself moves. Platforms silently update models, roll out new tools, and re-tune their inference stack outside of your control. On top of that, the web the models search is changing under them. No amount of measuring on a given day can remove this noise.
A few concrete examples of each:
Table 1. The three forces behind movement in a tracked metric, with concrete examples.
These three forces map onto three things we actually control: how many times we run a prompt each day, how many days we track it, and which prompts make up the portfolio. The experiment below pulls them apart.
The experiment
To isolate the effect of run frequency, we ran two copies of the same tracking setup side by side for two weeks. One ran every prompt once a day; the other ran the identical prompts ten times a day. Everything else was held constant: the same 753 prompts across the same 7 platforms (ChatGPT, Google Gemini, Perplexity, Microsoft Copilot, DeepSeek, Google AI Mode, and Google AI Overviews) in the US, yielding 5,271 prompt configurations in all.
In total, this works out to roughly 129,000 runs in the once-a-day instance and 860,000 for ten-times, producing about 883,000 and 5.78 million citation slots respectively. With one setup running 10× as often as the other, we can compare readings directly and separate the noise that shrinks with more runs from the noise that doesn’t.
Results
Does a single daily reading match the heavy one?
Every day, both setups are trying to measure the same thing: the portfolio’s visibility and citation share for that day. The 10× setup pins that down tightly, from about ten runs per prompt. The 1× setup has a single run per prompt to work with.
They land in nearly the same place. Averaged over thousands of prompts, a single run a day tracks the ten-run version closely: the typical day-to-day difference between them is about 2 percentage points for visibility and 0.3 points for citation share. Averaging one draw across a large portfolio does most of the work that extra runs would have done.
Table 2. Headline estimates over the 14-day window. The two cadences land within a couple of points of each other.
What this means: the full portfolio is already doing the averaging. Because you’re pooling one run each across thousands of prompts, a single daily pass gives you a reading that’s very close to what you’d get from ten times the runs, at a tenth of the cost.
How much does the answer drift on its own?
Hold the portfolio fixed and the daily number still moves for two separate reasons: the finite number of runs in a day (which more runs fix) and genuine day-to-day drift in the platforms themselves (which they can’t). That drift is a floor: the best precision any run count can ever reach, because it’s movement in the underlying reality.
Because we measured at both 1× and 10×, we can split the total movement into these two pieces and see how big the floor is. The exact decomposition is in the methodology.
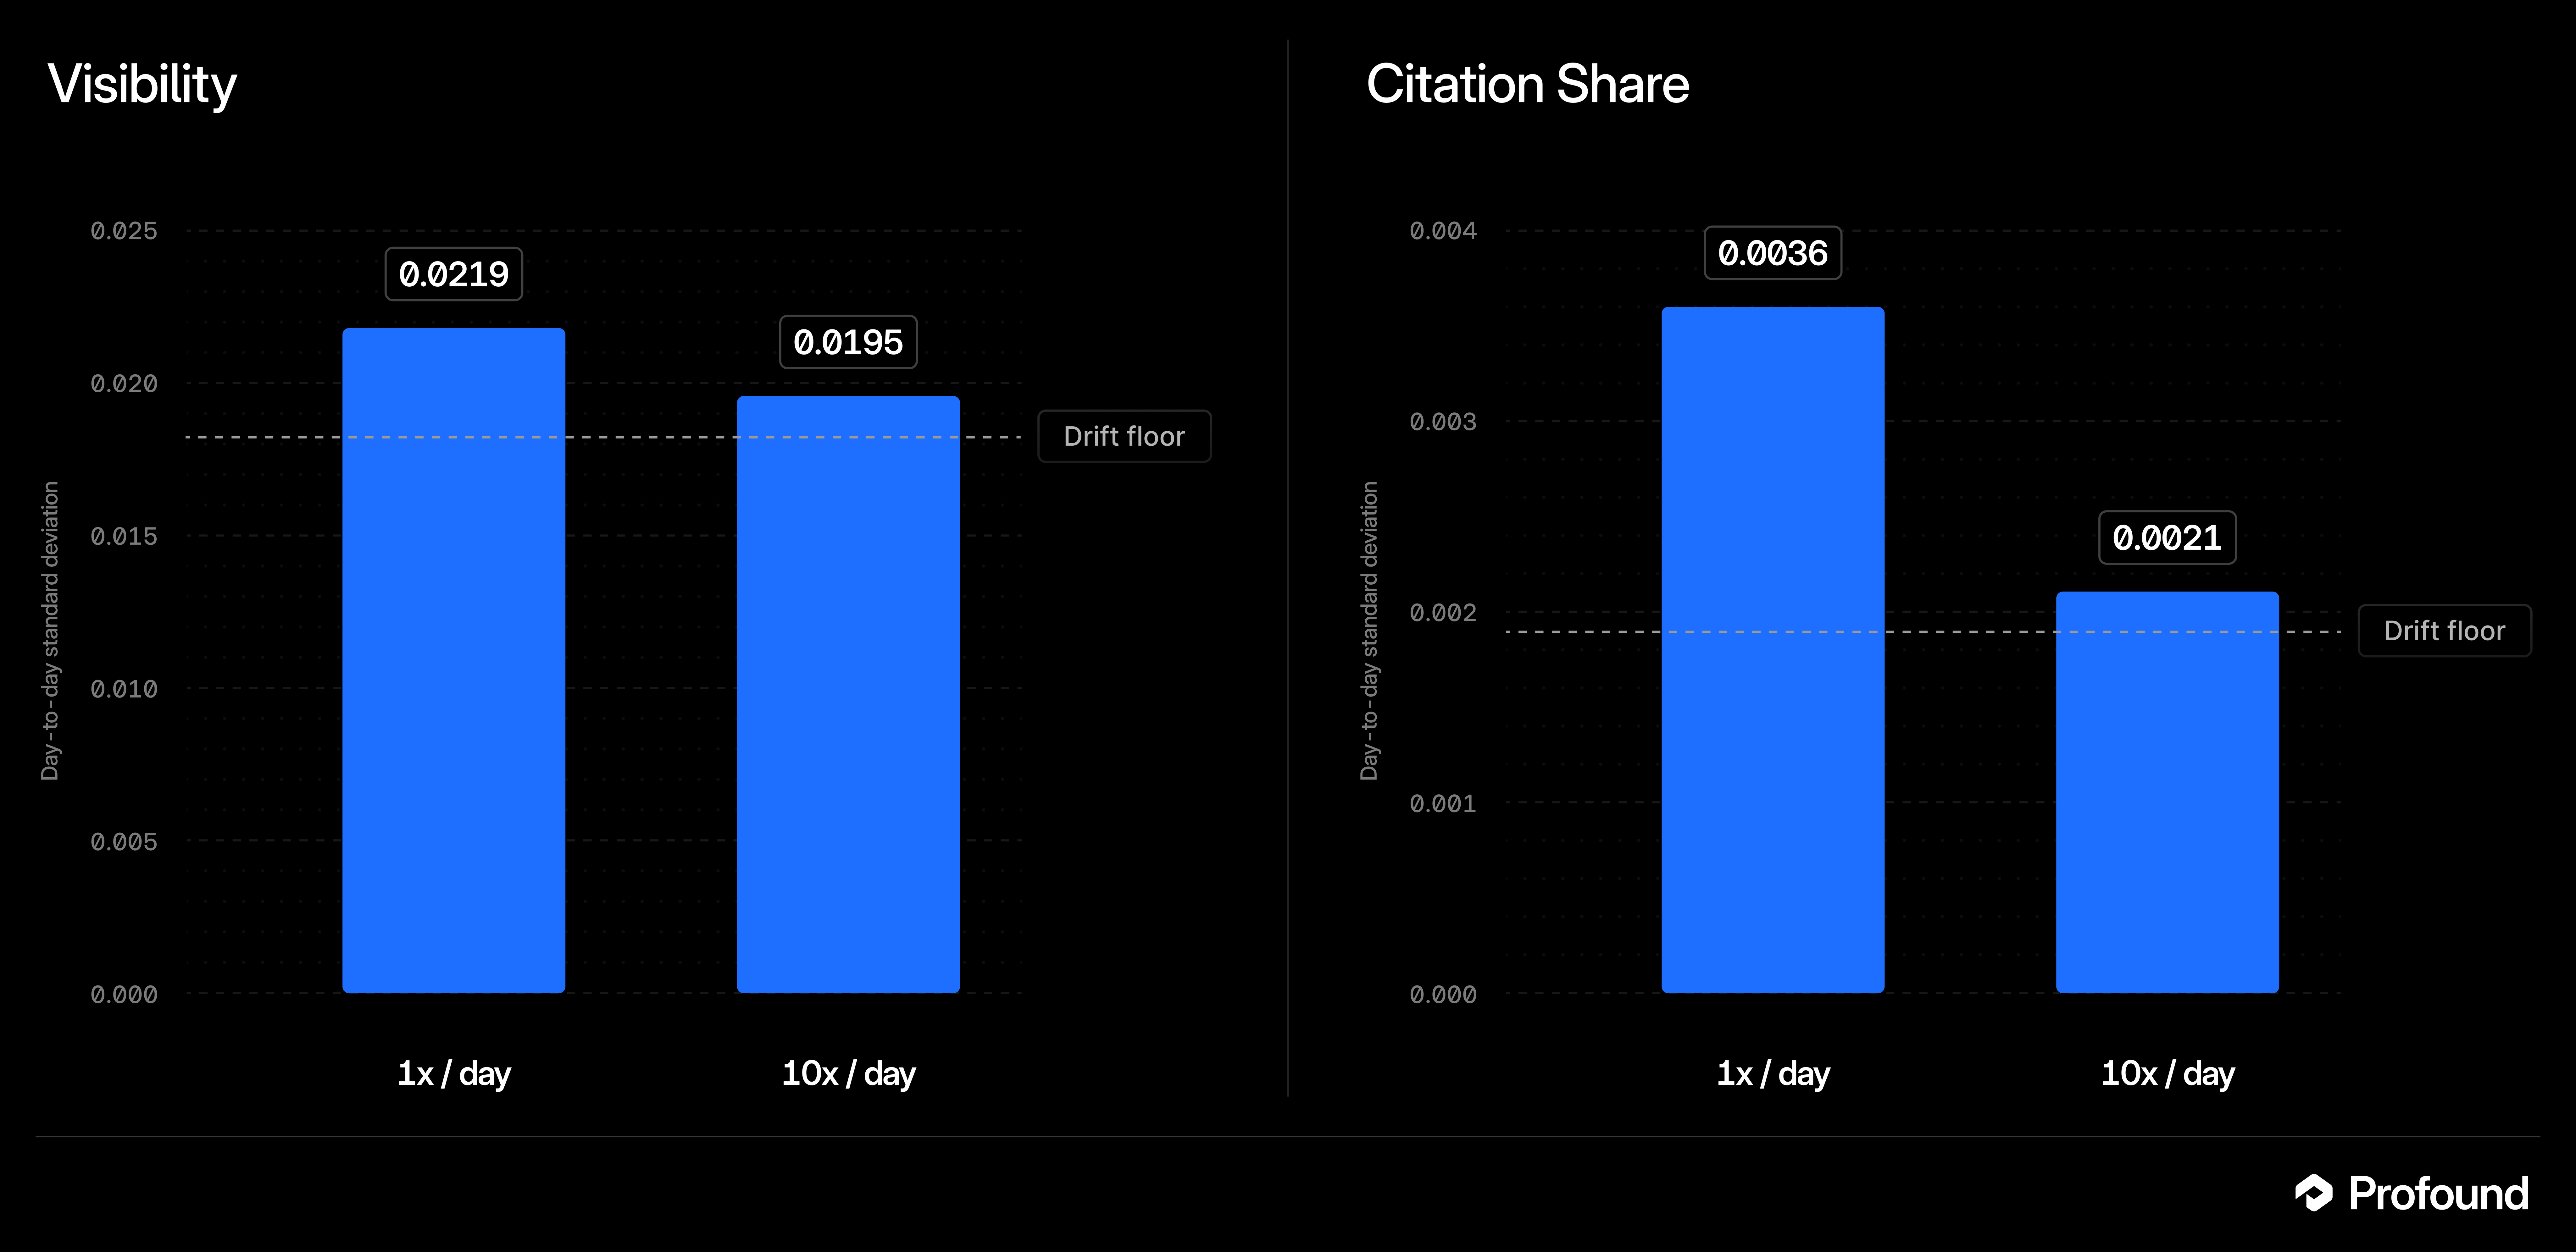
Figure 1. Day-to-day movement at each cadence, against the drift floor. For visibility, once a day is already essentially at the floor; for citation share, ten runs a day close much of the remaining gap.
Table 3. Day-to-day standard deviation of each metric, decomposed. “Movement” is the daily standard deviation; the drift floor is the portion no run count can remove.
For visibility, once a day is already essentially at the floor. Going to 10× tightens the daily number by only about 11%. For citation share, there’s more to gain: 10× cuts the daily wobble by about 40%. But even at ten runs a day, most of the remaining movement is platform drift, not sampling. Intuitively, citation share is noisier per prompt because it depends on the retrieval process (which sources get cited, and how many) not just a yes/no mention.
What this means: for visibility, spending more on run frequency buys you almost nothing. For citation share, it buys a modest improvement, but if you want a materially steadier share-of-voice number, portfolio construction is the bigger lever, not more runs per day.
Does it matter which prompts you pick?
A portfolio is a choice. The prompts you include decide what visibility and citation share actually mean: awareness in a market you define, sentiment toward one product, or any of countless other intents. Holding the intent steady, we wanted to know how sensitive the results are to the particular wording of the prompts you happen to choose.
To test this, we built 2,000 synthetic portfolios by resampling the original prompts (same intent, different mix of phrasings) and measured how much the results moved. (We resampled at the prompt level so that each prompt’s full history over the two weeks stayed together.)
Turns out, portfolio composition matters quite a bit: a lot for citation share, less for visibility. For citation share, the sensitivity to prompt mix was an order larger than day-to-day platform drift. For visibility the effect was smaller, on the same order of magnitude as drift.
What this means: how you build your portfolio is a first-class decision, not a minor detail, especially for citation share.
Putting it all together
Stack up the three sources and combine them the way independent sources of variation combine (the square root of the sum of squares; details in the methodology). The result: our standard setup of running each prompt once a day, over a two-week window, across a portfolio of thousands of prompts measures both visibility and citation share with more than enough precision for the decisions marketers make with them.
Running 10× or 100× wouldn’t meaningfully change what the numbers tell you. The randomness that extra runs remove is already small; the movement that’s left is the platforms themselves changing. This is exactly what you want a tracking tool to capture, not average away, so once a day it is.
Getting started
Want to see how your brand shows up across ChatGPT, Gemini, and every other AI platform that matters, tracked daily, with the statistical rigor to back it? Talk to our team to get started with Profound.
Methodology
Setup. Two internal instances over the same 14 days (June 1–14, 2026): one running each configuration once a day, one ten times a day, over an identical set of 5,271 configurations (753 prompts × 7 US platforms). We assume prompts are independent across platforms, regions, and personas, and we hold user-controllable settings (memory, custom instructions, and the like) constant across runs.
Variance decomposition. For a metric M measured from n runs per day, the law of total variance gives V(Mₙ) = E[V(Mₙ|p)] + V(E[Mₙ|p]) := S/n + D, where S is the within-day variance at a single run (treating runs as i.i.d. Bernoulli draws) and D is the day-to-day drift variance, independent of n. Two measurements, at n = 1 and n = 10, separately identify S and D.
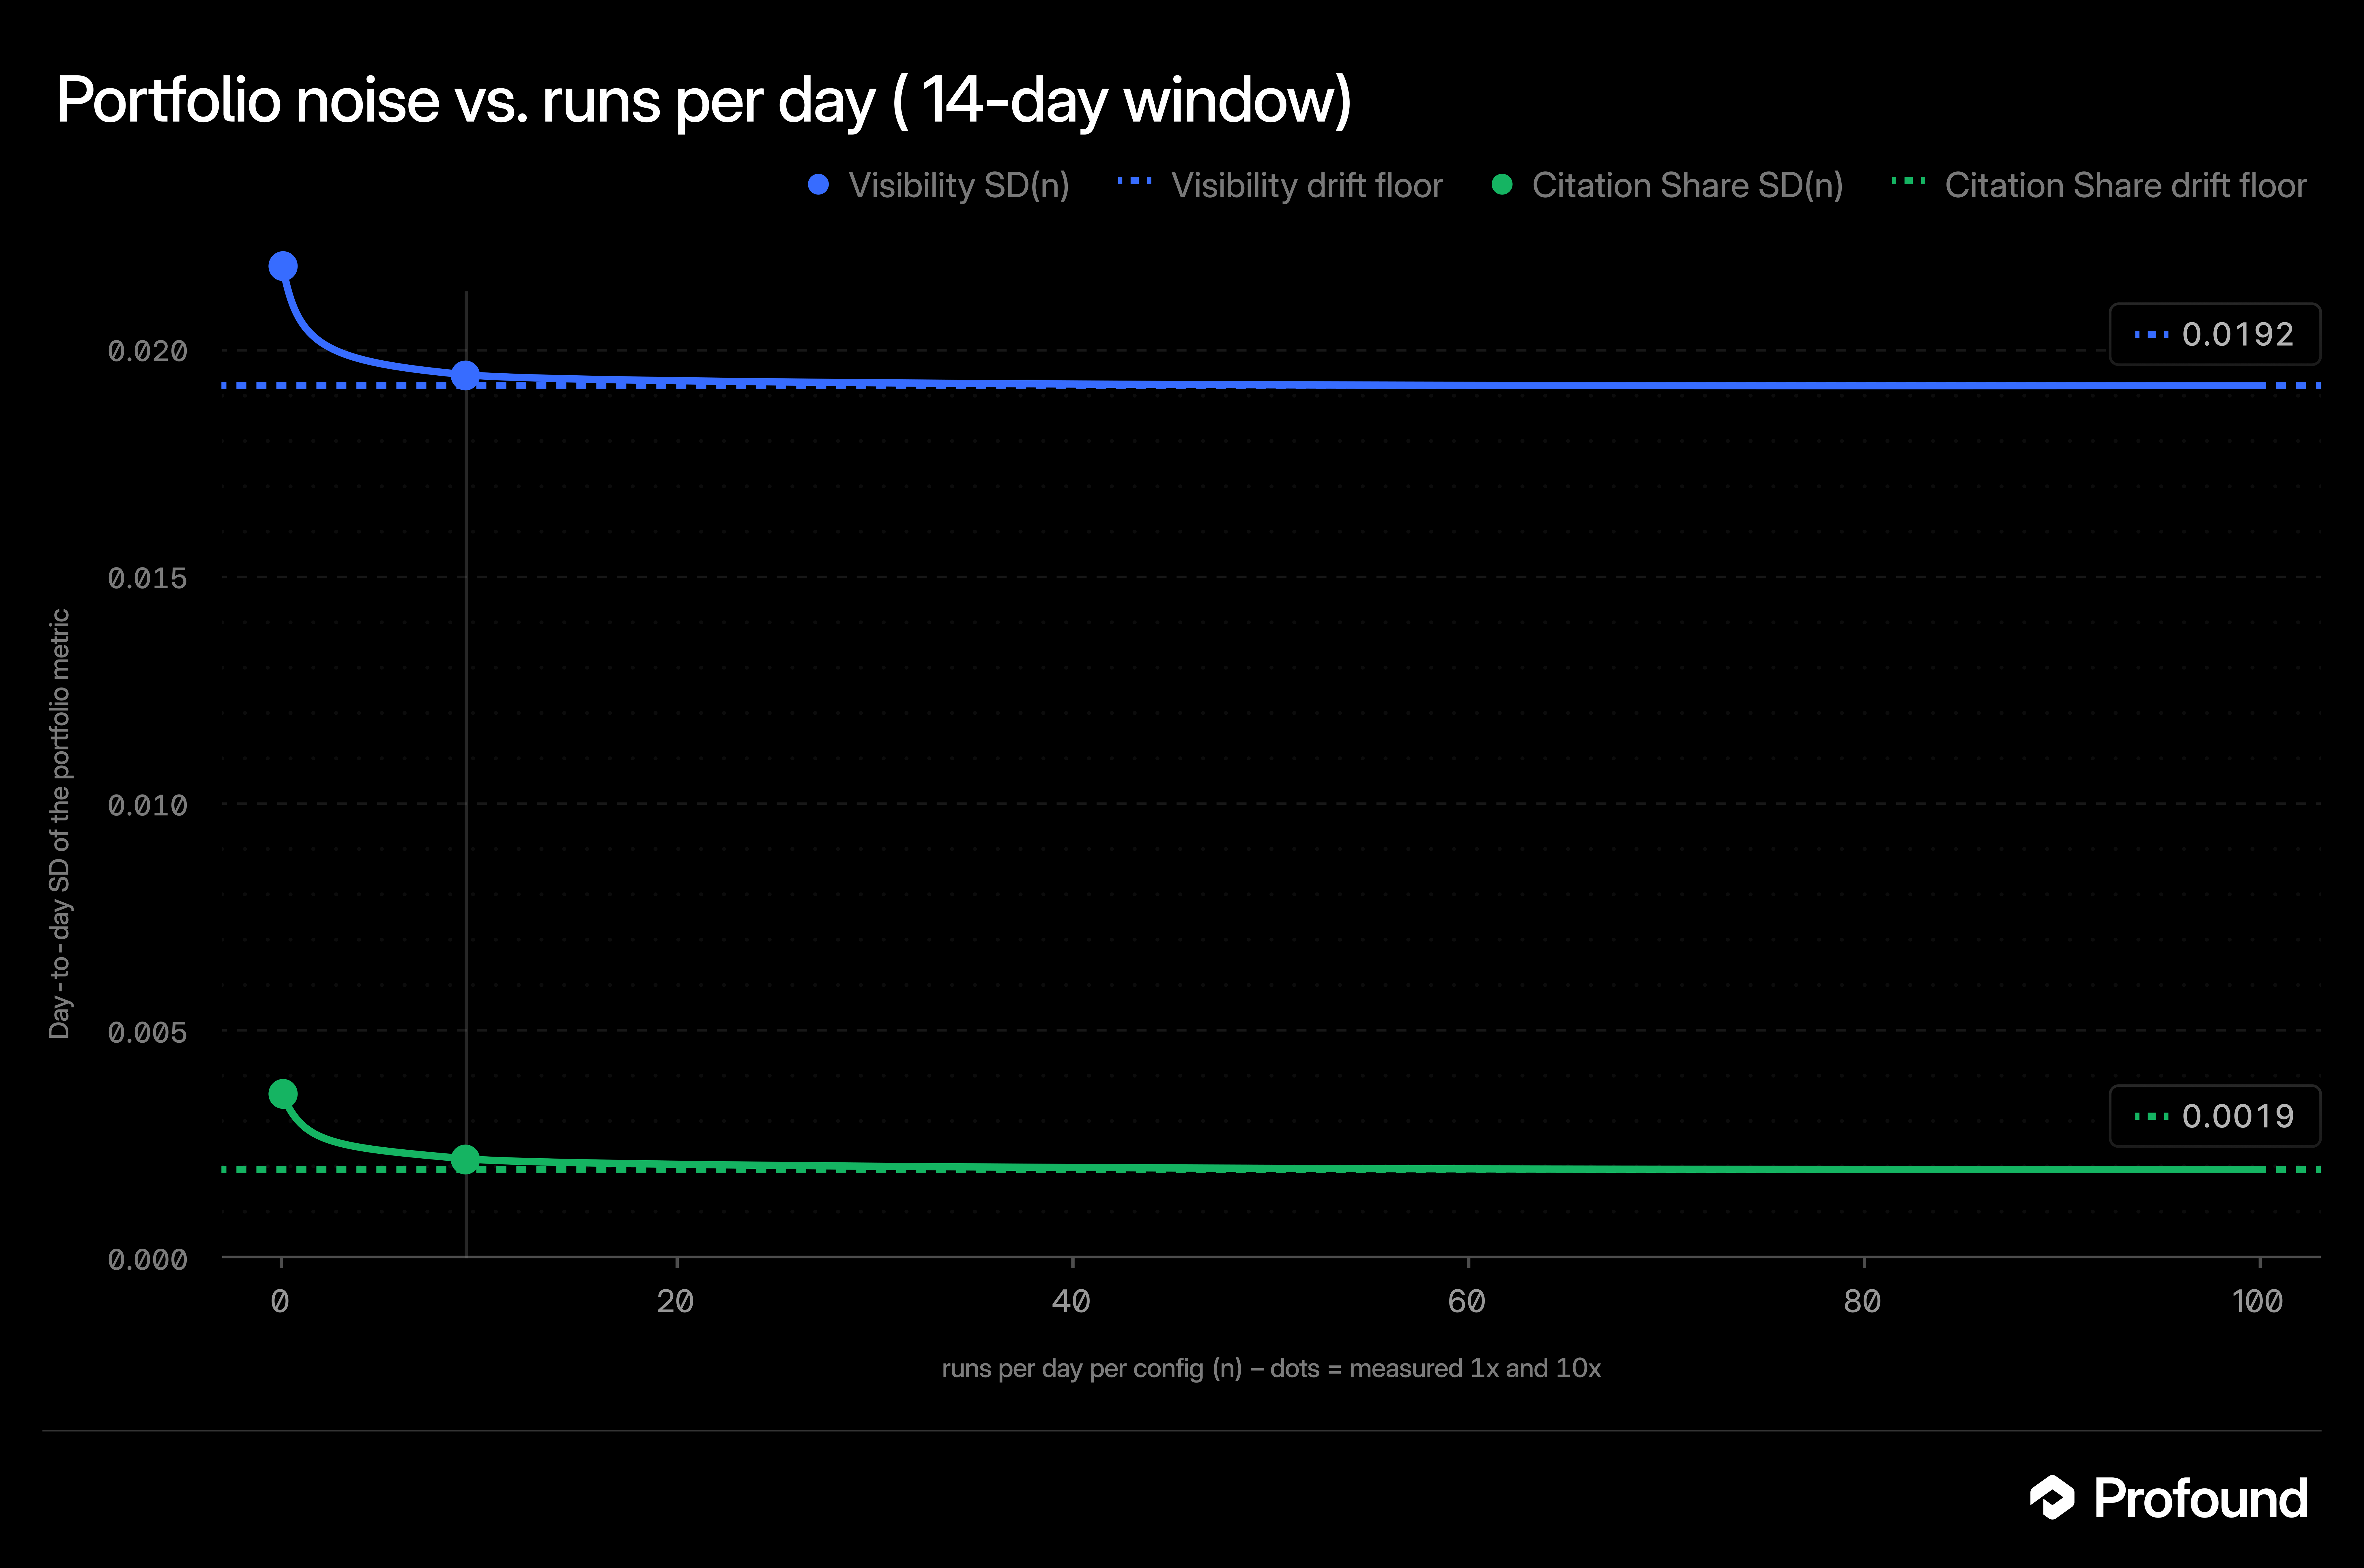
Figure A1. Portfolio noise as a function of runs per day, SD(n) = √(S/n + D). Dots mark the measured 1× and 10× instances; the dotted lines mark each metric’s drift floor (√D). Both curves flatten quickly — for visibility, the 1× point already sits almost on the floor.
Standard errors reported:
- Wald SD = √(p(1−p))/T, with p the sample mean and T the number of tracked prompts — the within-day sampling noise.
- Drift SE = √D/T, with D from the decomposition above — the day-to-day platform drift.
- Bootstrap SD = a two-level resample for portfolio confidence intervals: (1) resample whole configs (prompt × platform × region) with replacement; (2) within each selected config, resample all runs in the 14-day window with replacement (~14 runs at 1×, ~140 at 10×). Visibility uses the macro-mean of config rates (Binomial(n,p)/n per config); citation share uses total brand slots ÷ total slots. Reported values are the 2.5th–97.5th percentiles of the bootstrap distribution.
- Total SE = the three combined in quadrature (the square root of the sum of squares).
Full breakdown:
Table 4. Point estimates and the three standard-error components, combined in quadrature into a total.
References
On inference-infrastructure nondeterminism (batching and quantization variance): Thinking Machines, Defeating Nondeterminism in LLM Inference.
On platform-set system-prompt changes: Anthropic, Claude system prompt release notes.

