


ChatGPT visibility and conversions are strongly correlated. A joint study by Profound, Kevin Indig, and Eric Van Buskirk of Clickstream Solutions watched 56 people compare products inside ChatGPT across 221 real tasks, then matched what they chose against Profound's data on which brands ChatGPT actually cites. It is one of the first behavioral links between AI visibility and what people pick.
The brands participants chose appeared about twice as often in ChatGPT's answers as the ones they passed over (24% share of voice against 11%). Visibility and choice correlate strongly at 0.57 and 92.8% of tasks ended with no click to the open web!
Inside ChatGPT, share of voice is shelf space. And shelf space predicts the sale.
Share of voice predicts conversions
Shoppers act on whatever ChatGPT presents to them. The more a brand shows up when someone asks about a category, the more likely that brand gets chosen. Across categories, that relationship holds at a correlation of 0.57.
The link is strong but not deterministic. It runs as high as 0.87 in pet insurance and 0.97 in grocery, then collapses to 0.13 in meal delivery, a category with enough brands to trust the number. A few heavily cited brands still lost..
One boundary is worth stating plainly. What the study measured is share of voice, how often a brand appears across answers, not its rank inside a given section. ChatGPT returns many sections per answer with only a few citations in most, so citation rank within a section sits outside what this data can claim. Citation rank could be counted via the right-rail results panel, but those ordinal “ranks” are not useful since they’re not split by section. Visibility matters most when the shopper knows little about the category. Prior category knowledge was low or medium in 88% of tasks. When a shopper arrives without a preferred brand, the model's shortlist becomes the map, and visibility does the most work exactly there.
The link is strong in most categories, though coaching (-0.98) and fitness apps (-0.44) reverse it, likely noise given how few brands sit in each.
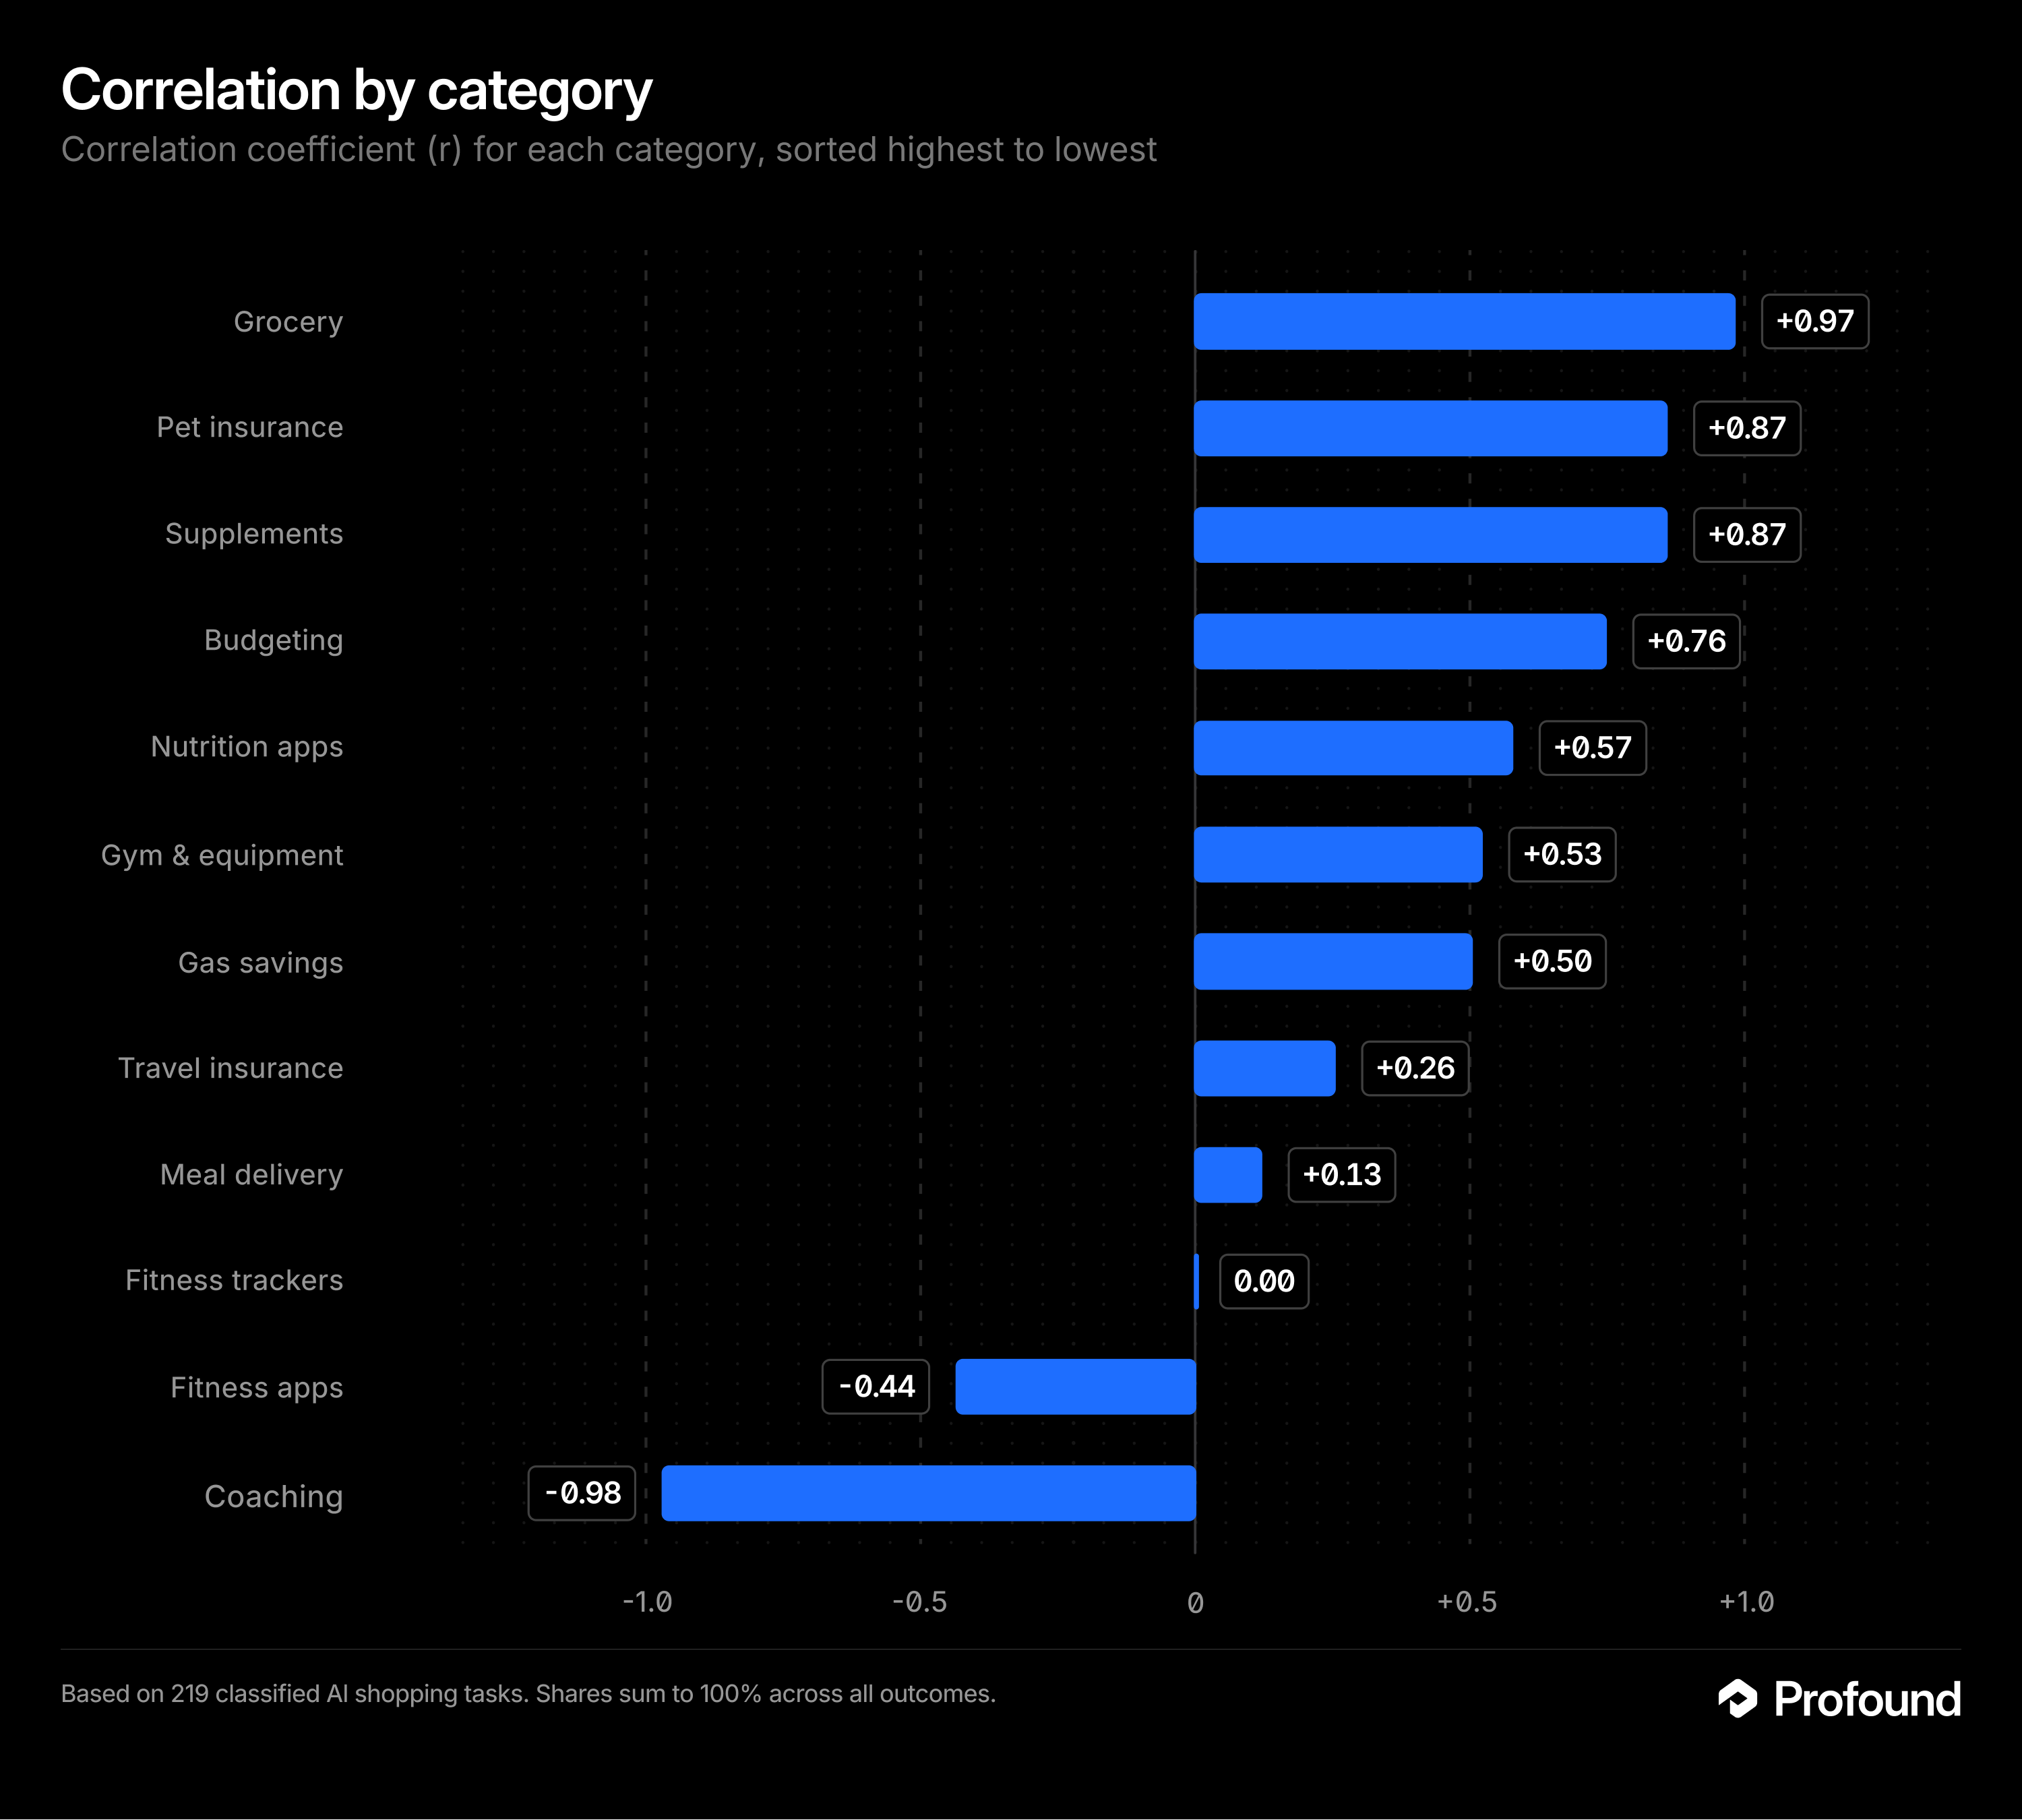
Table 2. See Appendix A to see the sample sizes for each brand
Unknown brands can instill curiosity
When ChatGPT named a brand a participant had never heard of, curiosity spiked and the brand often survived to the final shortlist. "I've actually never heard of Misfits Market, and I am super interested," one participant said. Another: "both services I didn't know existed before this study".
The jump from first exposure to active comparison happened inside a single sentence. "I've never done pet insurance. I do have a dog, so that would be interesting to me. Now help me find pet insurance." One prompt, and a cold category turned into a live decision.
Presentation decided which newcomers survived. Top-listed options drew more attention and more text, a clear "best for" label gave the shopper a reason, and a plausible price sealed it. Lower-ranked options lost for a structural reason too: the model hands them less to work with. "The less information I get, it feels like they give up on the lower options," one participant said.
The only reliable killers were price, poor fit and a disclosed downside. Unfamiliarity almost never did the damage. That is the opening for a challenger. A brand nobody has heard of can win the shortlist in one session, as long as the model lists it and frames it well.
The catch: the study pushed participants to "pick two" in the task, which nudged people toward finalizing, and the sample is small. Read near-universal curiosity as strong inside the study and directional outside it.
The decision happens without a click
Clicks barely happen. 92.8% of all tasks ended with no meaningful click to the open web, and 3.2% verified a claim on an outside site. No participant cross-checked a single price externally! Eight participants clicked out during their entire study; nine clicked out two to three times.
Checking did happen, but it stayed inside the chat. Almost half of tasks, 48.9%, ended with the shopper accepting the named options and no follow-up at all. When people did push, they asked ChatGPT to justify itself, 38.8% of tasks, far more often than they opened a new tab. The verification talk was aspirational. Participants said they would go read Reddit, then mostly did not.
For a marketer, the meaning is uncomfortable because analytics will never track this. No click means no referral session and no last touch to attribute, so referral and click-through reports undercount the channel by design. It also means no correction step. Nobody lands on your site to discover the real price or the feature ChatGPT left out, so whatever the model says stands as fact. The work moves off your website and into the answer itself.
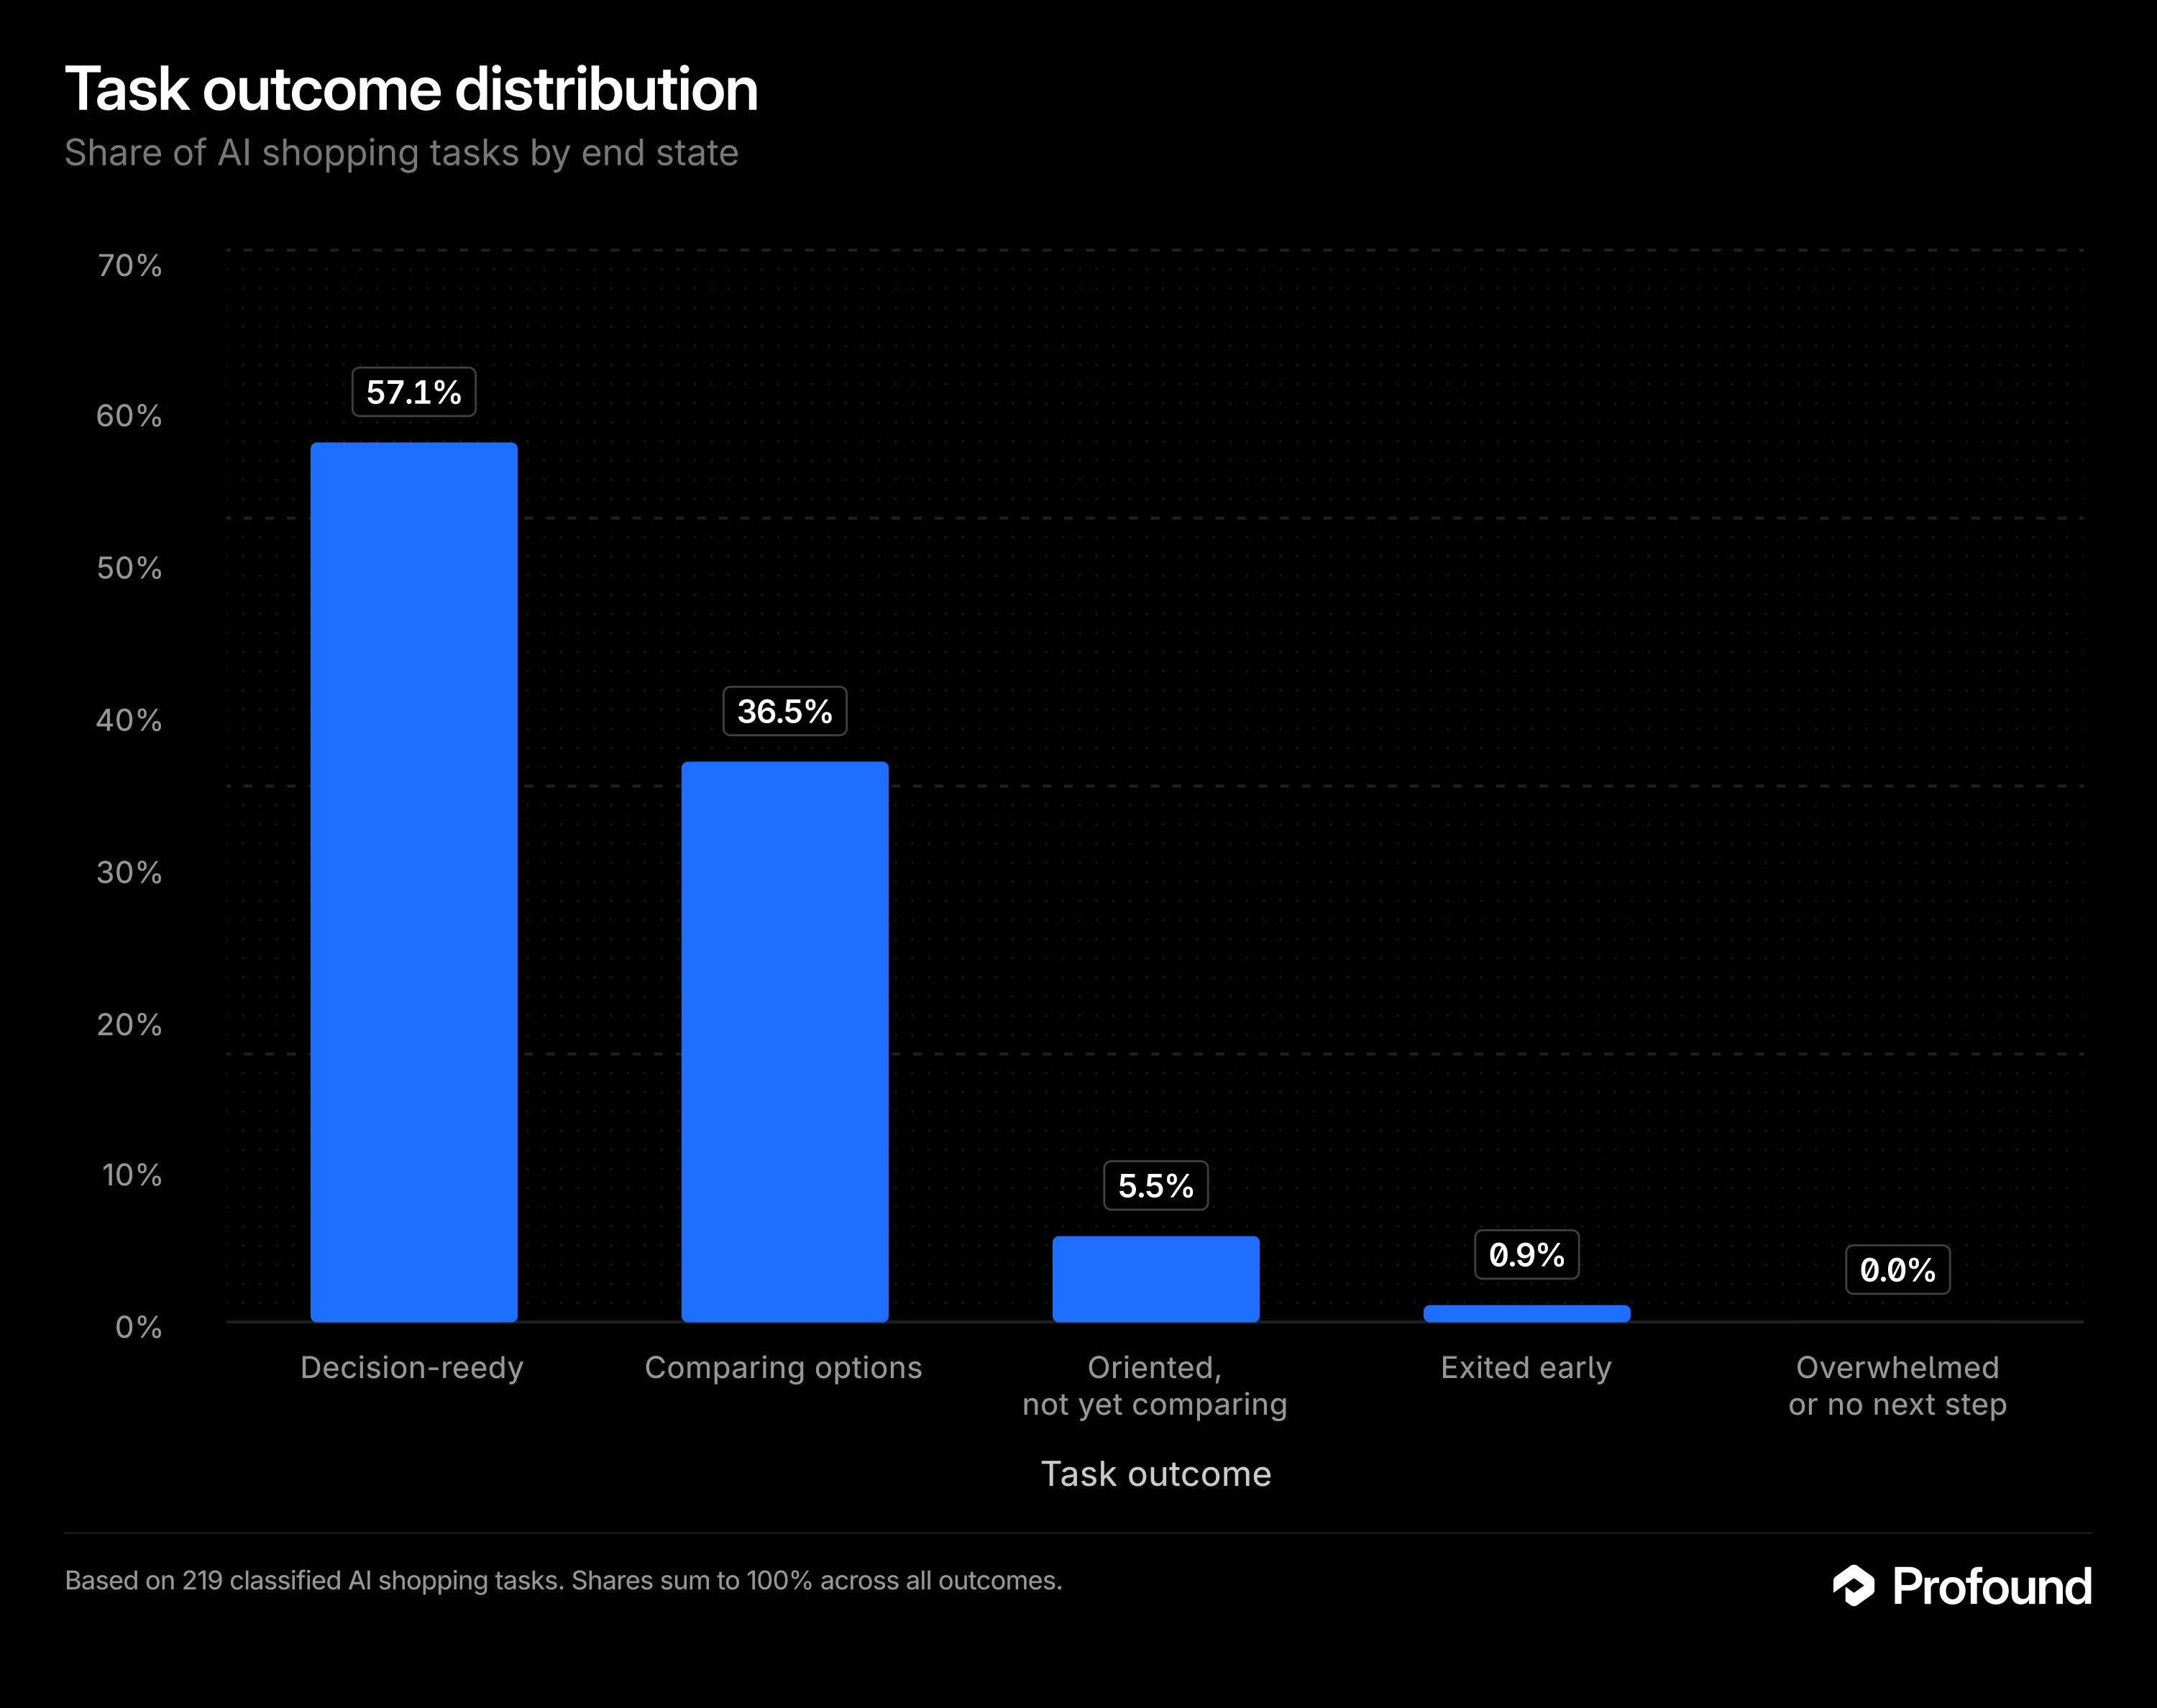
Table 4. See Appendix B for confidence intervals
Assessable base of 219 tasks, with N/A excluded. Together, 93.6% were comparing or decision-ready, and none ended overwhelmed or without a next step.
The comparison grid is the decision surface
A grid is the comparison table ChatGPT builds when you ask it to weigh options: brands down the side, attributes across the top, price and "best for" and key features in the cells. Options sit side by side, and the shopper reads across.
That grid is where people choose products. Working from screen recordings, annotators coded which on-screen element held attention longest in each task. After the plain answer text, the grid won. Brand and product grids dominated 35.9% of tasks and feature grids another 15.0%, more than any other structured element. In 65.4% of tasks, people scanned rather than read closely
They loved it. "These tables are epic." "This table format makes it easier to scan through the differences quickly instead of reading long reviews." Several learned to prompt for a grid outright! One kept using a grid after seeing it was incomplete: "So this isn't even a full complete chart, which is not great. But this helps me the most, so I'm going to continue going off of these".
For an unfamiliar brand, the "best for" label and the price cell stood in for everything the shopper did not know. Your row is your shelf placement. Whether you appear, what label you carry, and what price sits beside you settle the comparison before the shopper forms an opinion. Clean specs, named use cases, and a current price are what put a brand in the grid. Getting lifted into that table is the AEO equivalent of owning a featured snippet.
After the plain answer, the grid held attention more than any other element, and users scanned it. Mean task time was 236 seconds.
The lever is how ChatGPT presents your brand
Shoppers' confidence in their own decision rose in 81.9% of tasks and fell in none. In the post-study survey, 91.1% of participants rated their confidence in ChatGPT's information a 4 or 5 out of 5. People left more sure of their choice, no matter which shortlist the answer handed them, which means being on the shelf beats being the best option in the category.
So the lever is framing: how ChatGPT presents your brand inside the answer. In plain words, framing is four things:
- Whether you show up in the grid.
- The "best for" label you get.
- The price shown beside you.
- And whether a downside rides along.
Framing also sets the terms of the comparison. When ChatGPT names a criterion the shopper had not considered, they adopt it as their own and call it helpful. "Which I didn't think about, but that is very important". The brand whose content defines that criterion owns the comparison that follows.
Each of these is a place to work.
- Raise share of voice in the categories where your buyers lack priors, because visibility does the most work there.
- Earn a row in the grid with clean, liftable specs and a "best for" label that names exactly who the product is for.
- Keep your price current everywhere the model reads it. A wrong price gets treated as truth, and a vague or missing one takes you off the list.
- Find and fix the disclosed con. One negative clause is enough to drop a brand. One shopper cut DoNotPay the instant ChatGPT noted it had run into legal trouble, then praised the model for the warning: "I love that it's telling me right off the biggest downside of each. That feels very honest".
Knowing what ChatGPT says about your brand, downsides included, is table stakes now. None of it shows up in referral traffic, so none of it is visible on the dashboards built for the click era. Presence and framing inside the answer are the new shelf, and they are finally measurable. The brand that wins is the one the model reaches for and describes well. Start by finding out what it says about you today.
Methodology
The study used results from multiple sources to analyze participant behavior. Analyst annotations of participant desktop videos, audio transcripts, questionnaire instruments, and cross-correlation of all data. 56 people completed 224 tasks, 221 of them codable, and 51 produced usable think-aloud transcripts. UX Tweak was the enterprise-level software platform the study was run on.
- Behavioral annotations. Coders watched screen recordings where participants used a think-aloud protocol. They coded 221 tasks for prior knowledge, whether the user framed the question vs. letting the AI do it, which criteria mattered, who introduced each brand, how the user investigated product categories, whether verification happened, and final product choices. This is the backbone, roughly 85% of the evidence and the primary record of what people did.
- Think-aloud transcripts. 51 participants narrated their reasoning while they investigated product categories. Transcribed audio was analyzed using AI assistance and then cross-checked against the source videos, so quotes are verified rather than model-generated.
- Questionnaires. Participants answered before, during, and after each task, capturing stated intent and exposing the gap between what people say and what they do.
- Share-of-voice join. Profound’s SoV feature was used to measure which brands are actually cited by ChatGPT for queries/questions. 6,882 citations across 36 representative questions were matched against what participants chose. Correlation scores run from 0 to 1, with 0.5 as a clear link.
The sample skews experienced: 66% of participants used AI chatbots daily and 93% at least weekly, so the confidence and trust findings reflect an experienced-user baseline. The final 56 is a screened sample, and anyone who failed embedded attention checks, skipped the think-aloud protocol, or hit technical issues was cut. Percentages carry 95% confidence intervals (Wilson score method), and the statistical modeling was run by a PhD-level analyst with experimental-modeling experience.
Three limits are worth holding. This is a session-level analysis, so the tests treat each task as an independent draw and the p-values run optimistic. A structured think-aloud does not perfectly mirror everyday browsing, though several participants wrote in afterward to say the tasks helped them with real decisions. And correlations in thin categories, under five brands, are directional only.
Data credit: Profound, Clickstream Solutions and Kevin Indig.
Appendix
Appendix A: Full results of the correlation by category table
Appendix B: Full results of the task outcome table


