
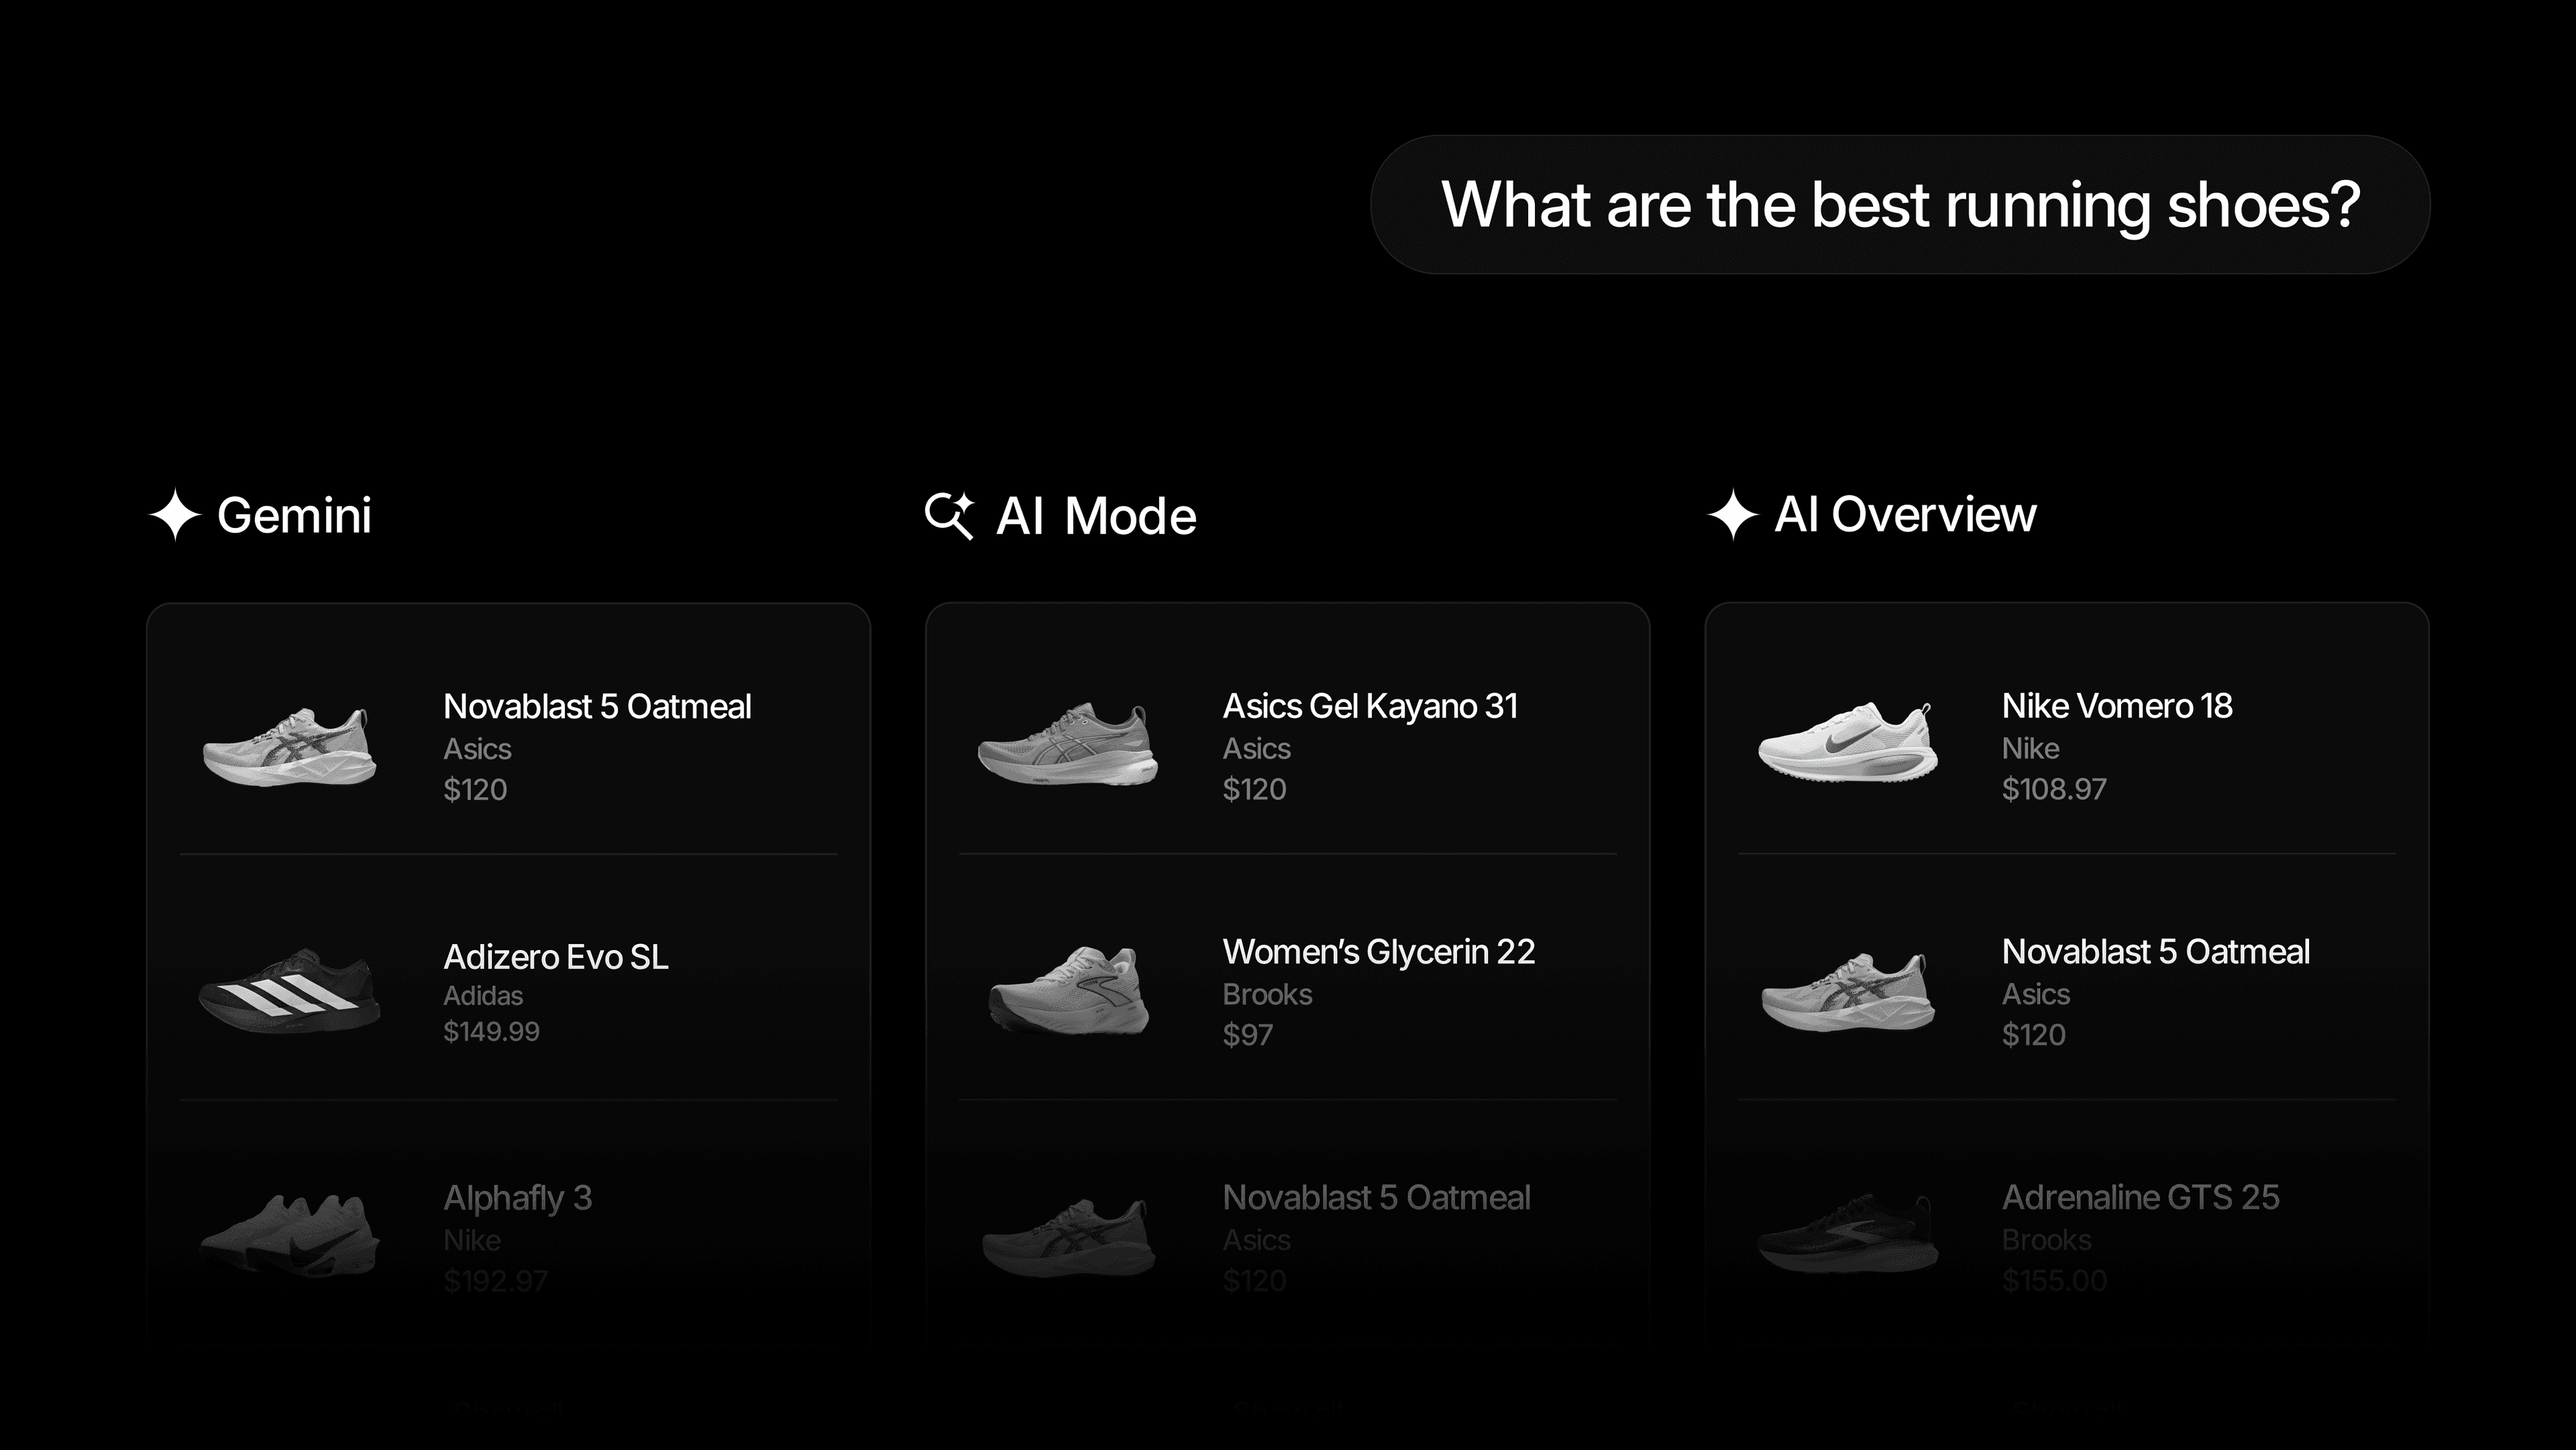
Gemini, AI Overviews, and AI Mode are built on shared infrastructure. We track them as separate models in Profound, and this is why.
- Brands see a median 8-point daily visibility gap between Google's three models.
- The models mention roughly the same number of brands, but they consistently choose different ones.
- They also cite different sources. Gemini leans editorial, while AI Overviews and AI Mode rely more heavily on social and UGC.
Visibility and position
Across 15,155 brand configurations tracked daily through the month of May 2026, the median brand faces a daily visibility gap of 8 percentage points between its best and worst Google model daily. More than one in three brands see the gap exceed 10 points. Scores naturally drift a few points day to day within each model given their probabilistic nature. However, the cross-model gap is 2.2× larger than that baseline variation.
On average position (the order a brand appears in the answer when it does show up), the divergence is even sharper. A single model's rank for a brand drifts about half a rank (0.53) day to day; across models the median daily gap is 3.36 ranks, a 6× spread over that noise floor.
The more striking finding is how these models behave, with the performance pattern inverting depending on the metric you look at. AI Overviews is the consistent low-scorer on visibility: it came out on top on only 14% of daily observations, versus 50% for Gemini and 35% for AI Mode. Flip to average position and AI Overviews leads by a wide margin, delivering the best (lowest) rank on 57% of daily observations, while AI Mode is worst on 47%.
A brand winning on one model and metric is no guarantee on another. To understand what is driving that divergence, we had to look past the scores and into the answers themselves.
Entity overlap
We took 2,346 prompts that all three models answered on every day of May 2026, extracted every company name each model mentioned across all 31 runs, and asked whether the models disagree on how many brands to feature, or on which brands altogether.
The answer is mainly the latter. Across 218,178 responses, the models name nearly identical numbers of entities. Gemini names 4.4, AI Overviews 4.5, and AI Mode 5.0. But the companies they name diverge sharply. For the same prompt, any two models share only about a third of their companies, while a model compared to itself across alternating days shares over half. The cross-model overlap is 35% below that within-model baseline, meaning the models are disagreeing structurally, not just probabilistically.
The disagreement is not uniform across pairs. In aggregate, AI Overviews and AI Mode are the most similar, sharing about 40% of their company mentions; whereas, Gemini only shares about 27% of its mentions with AI Overviews and 29% with AI Mode.
Citations depth and domain mix
The final lever underlying the difference across the Google Suite: the models pull from different places, at different depths. AI Mode cites most at 15.2 per run, AI Overviews 11.1, Gemini just 6.6. AI Mode and AI Overviews lean on social and UGC; Gemini skews editorial and reference.
Top 5 domains by global citation share per model, May 2026.
What to do about it
Pulled together, the picture is coherent: the visibility gaps are not a counting problem. All three models surface roughly the same number of brands per answer (4.4 to 5.0), so when their visibility scores diverge by 8-10+ points, it’s not by chance. They are filling the same number of slots with different brands, sourced by different citations.
So what does that mean for your brand:
- Continue to track Gemini, AI Overviews, and AI Mode as separate models. A blended Google line hides your real gaps.
- Find your widest cross-model gap first. The brands swinging 10-plus points have the most to gain from closing it.
- Identify the top domains feeding each model for your category.
For more information on how to win specifically in AI Mode check out this blog.
Methodology
Visibility and position analysis covers 15,155 brand-category pairs tracked daily across Gemini, AI Overviews, and AI Mode throughout May 2026, producing 1,483,629 observations. Entity analysis covers 2,346 prompts selected for having complete runs on all 31 days across all three models, yielding 72,726 responses per model. Company names were extracted from each response using gpt-4o-mini. Within-model consistency was measured by splitting each prompt's 31 days into alternating odd and even days and computing the share of company mentions that overlap between the two halves, removing any temporal trend from the baseline. Cross-model overlap uses the full month of mentions aggregated per model before comparison. Citation volume and domain mix are drawn from 2.64 billion citations across the three models over the month of May. All data is Profound internal, May 2026.


