
Introduction
Everyone knows AI has become part of daily life. Far less is known about the shape of that life: when people actually open an assistant, where in the world they are, who they are, and what they bring to each one. The large usage studies to date have each looked at a single product, and cross-platform comparisons have been rare enough that as recently as earlier this year, DataReportal's analysts noted that no comprehensive research yet existed on how people use AI across multiple countries and platforms.
This is our attempt to fill that gap. To our knowledge it is the first wide-scale look at the temporal patterns of AI assistant use that spans the leading platforms and breaks them down by geography, demographics, and topic at once. We analyzed roughly 300,000 conversations across the three largest assistants, ChatGPT, Claude, and Gemini, and sliced them by hour, day of week, region, age, income, and topic. Here is what we found.
TL;DR
- AI usage tracks office hours. Work prompts surge during weekday business hours and fade overnight, and about 77% of all conversations land on a weekday.
- The three assistants do different jobs. Claude is overwhelmingly a work tool: 71% of its conversations are work-related, against roughly 40% on ChatGPT and 43% on Gemini.
- The workday is loudest in Europe. Europe shows the sharpest split between professional and personal use through the afternoon; in North America the two run together all day.
- Age and income set the schedule. Older and higher-income users cluster in weekday mornings, under-29s peak on Sunday evenings, and the lowest earners use AI around the clock.
- Each assistant has a specialty. During the week, ChatGPT leans writing, Claude leans code, Gemini leans multimedia; over the weekend, topic trends shift.
A note on privacy: this analysis draws on a sample from Profound's datasets. Prompts were anonymized and summarized and no human ever read a raw user query for this analysis.
Each assistant keeps a different clock
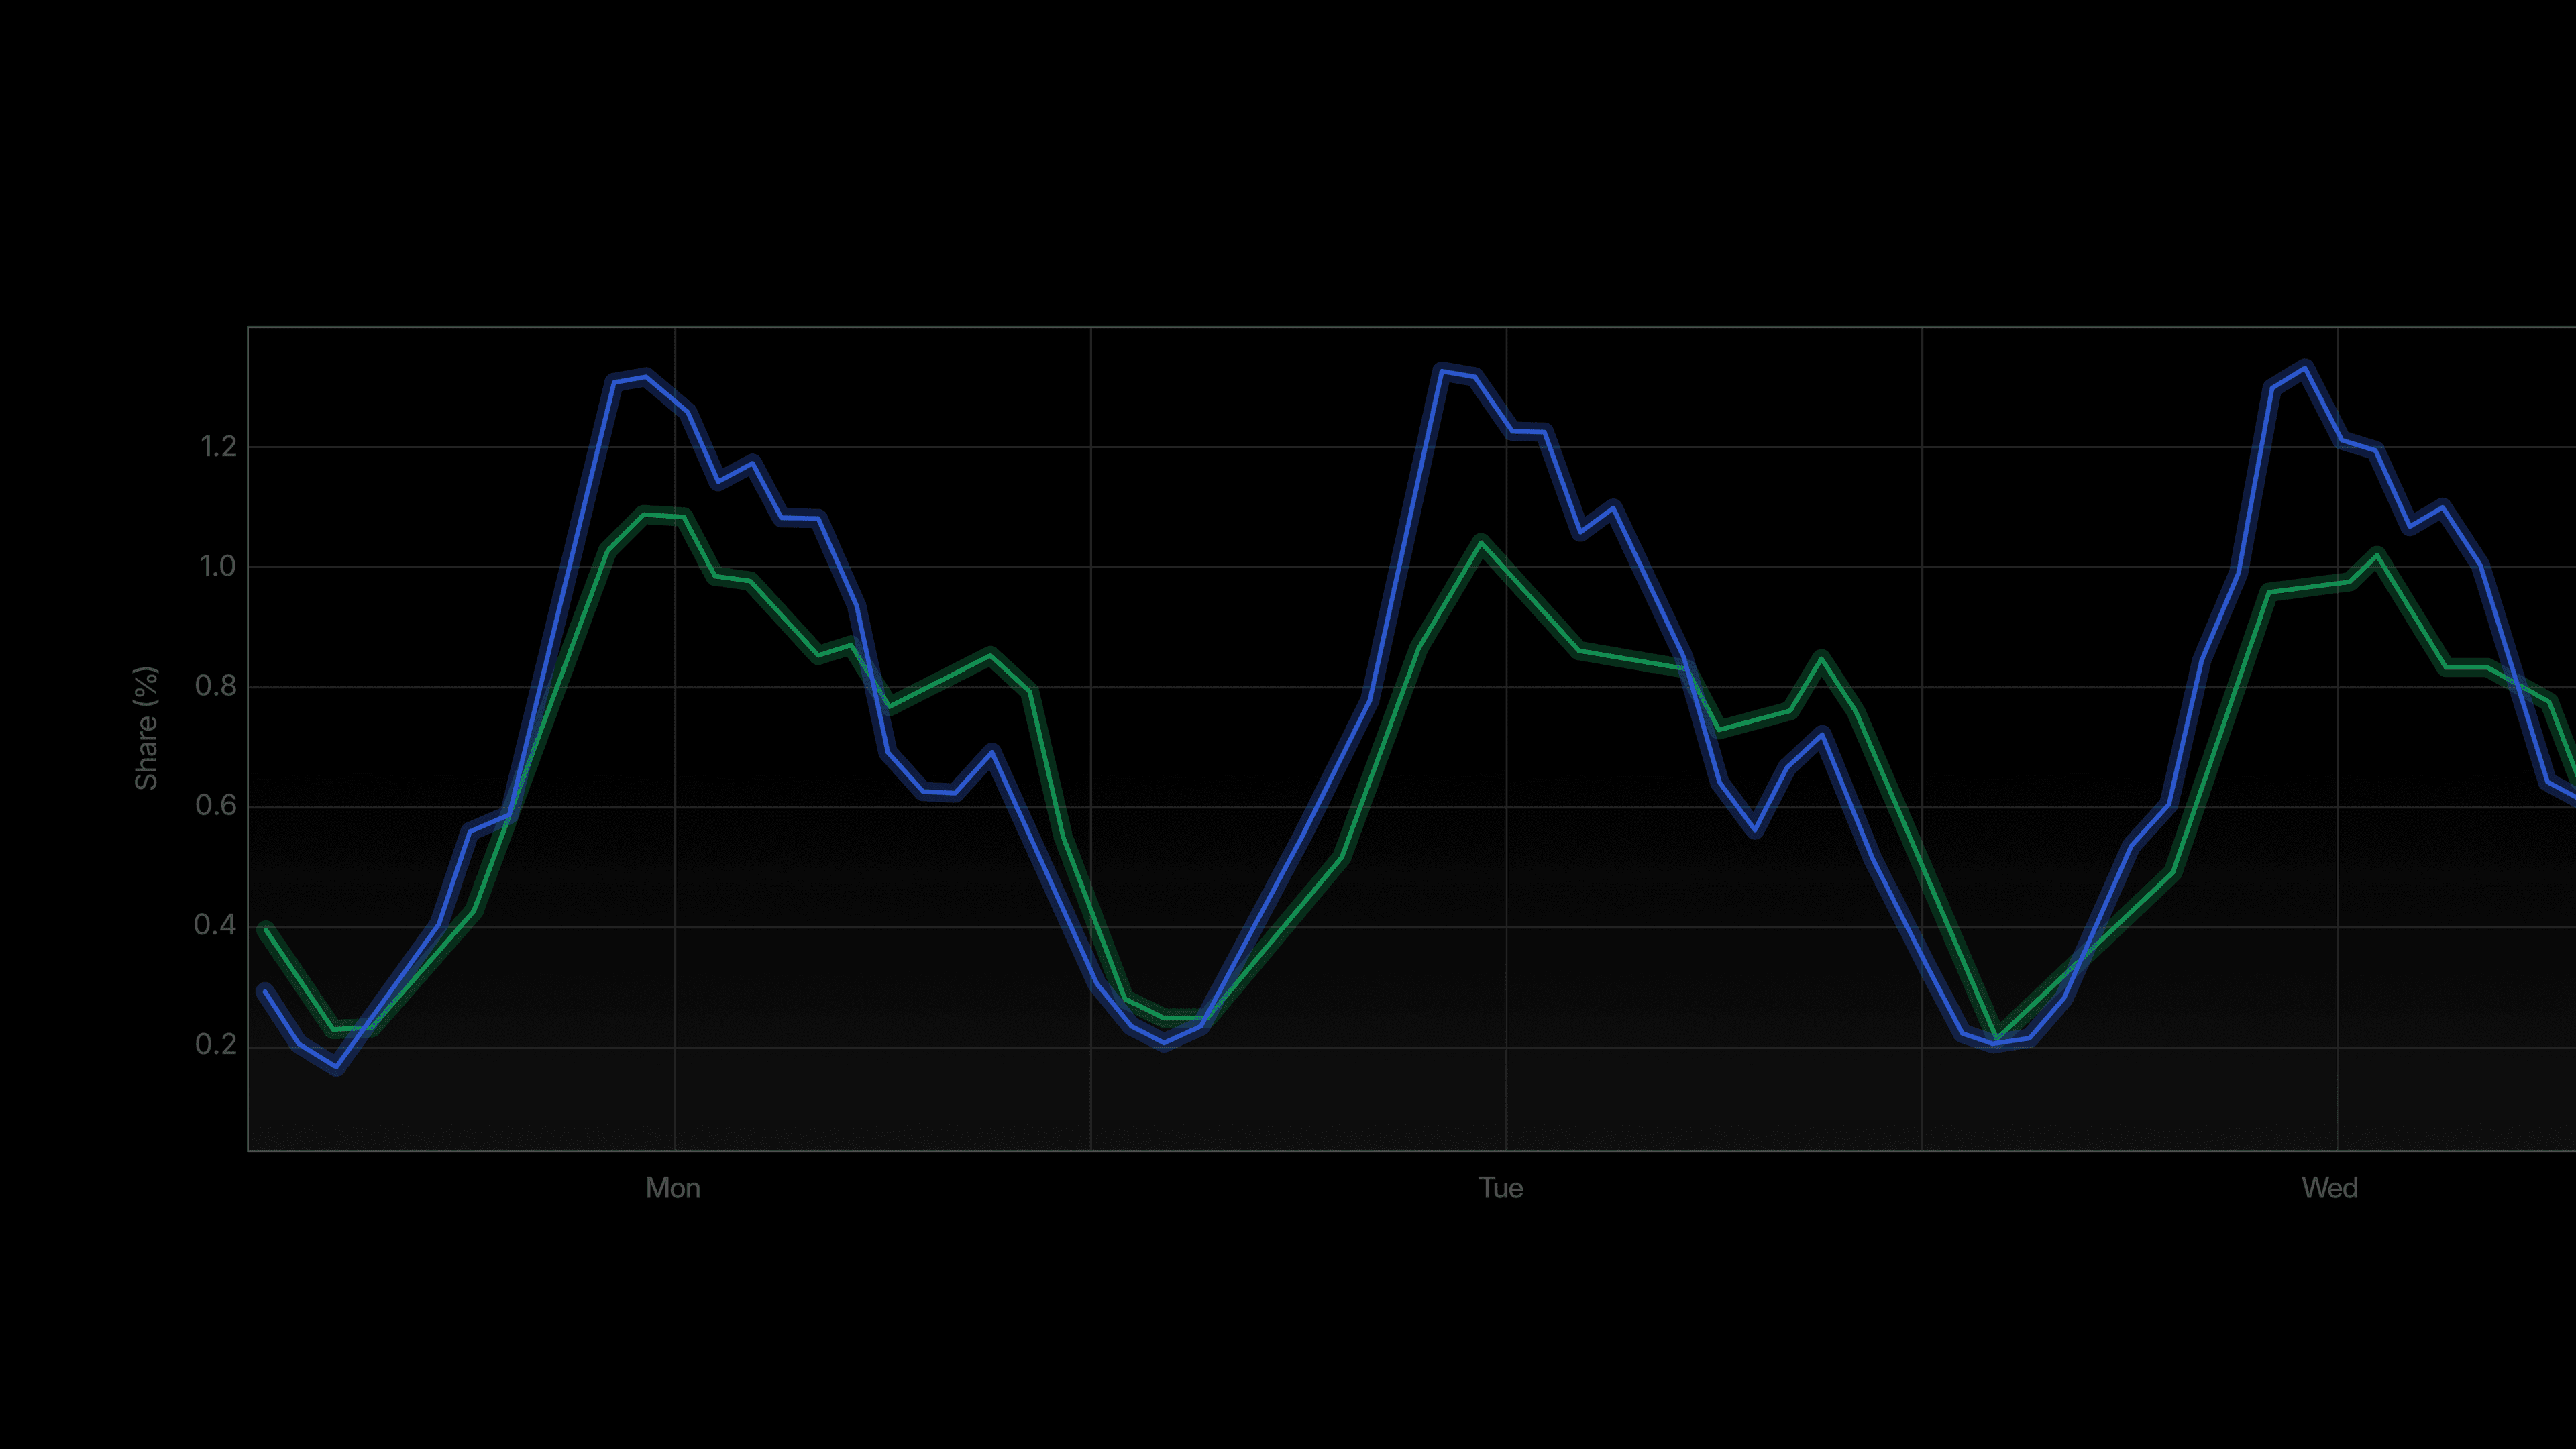
Across all three assistants, work-labeled conversation share climbs from an overnight floor near 2% to a peak around 11am local time, then fades through the afternoon and evening. Non-work runs flatter and takes over at night. On weekends the work hump deflates and the two lines converge, with personal use carrying the evening.
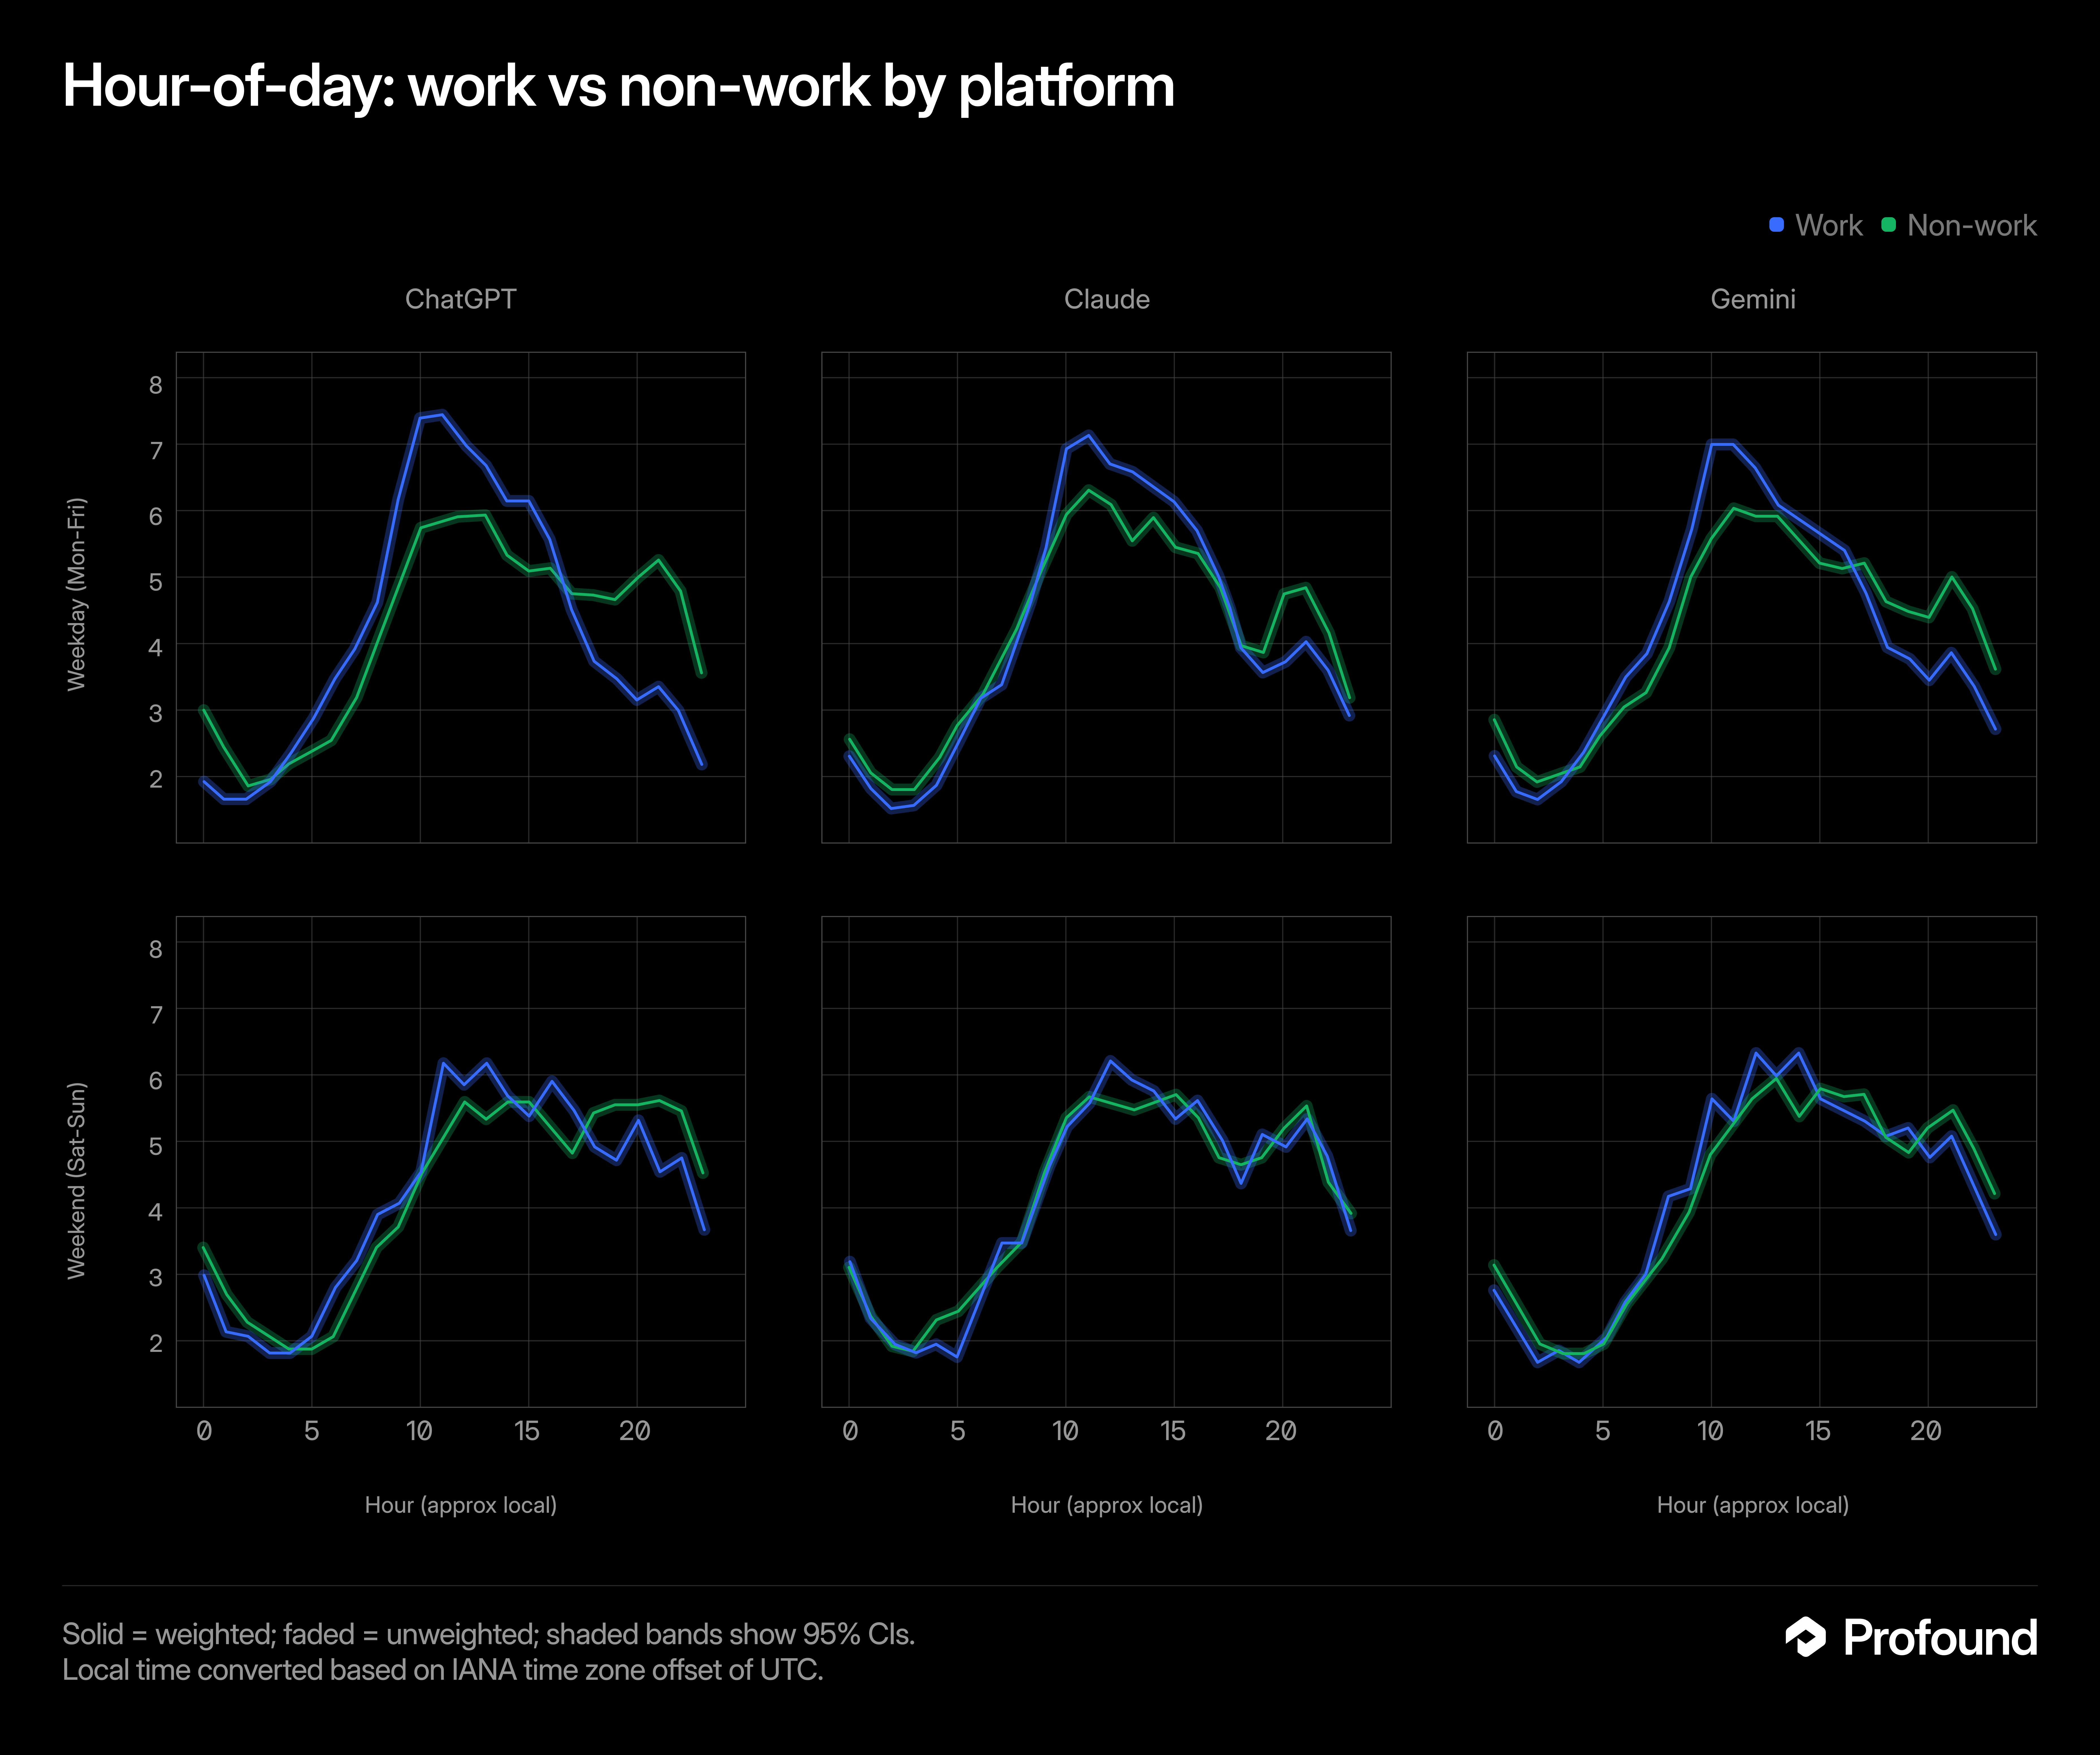
Figure 1. Work vs non-work conversation share by local hour, by platform. Top row weekday, bottom row weekend. Shaded bands are 95% CIs.
Claude is a work tool; ChatGPT and Gemini are mostly personal. Work accounts for 71% of Claude's conversations but only about 40% of ChatGPT's and 43% of Gemini's. In our sample, Claude also has the heaviest users; ChatGPT looks like a much broader public dipping in (with 58% fewer conversations per user).
ChatGPT has the sharpest intra-day swing, Claude the flattest. Table 1 measures each platform's daily rhythm as the spread between the hour when work most exceeds non-work and the hour when non-work most exceeds work.
Table 1. Peak work lead, peak non-work lead, and daily spread of work-minus-non-work share (percentage points; hours in 24h local).
ChatGPT's weekday work lead peaks at 10am and its non-work lead at 9pm, a 3.6pp spread. Claude's spread is about half that, both across the work/non-work split and across the weekday-to-weekend drop. Claude is the assistant people reach for at roughly the same rate whatever the hour.
One thing barely moves across platforms: the weekday habit itself. Between 76% and 78% of conversations happen on weekdays on all three, even though ChatGPT and Gemini are majority personal. People do a lot of their personal AI use during the working week too, not only on Saturday and Sunday.
What this means: a professional audience is reachable in weekday mornings, and most reachable where work use is high; a consumer audience lives in the evenings and weekends where non-work leads. Claude's flat clock means timing matters less there than the others.
The workday is a European story
Isolating trends by geographic region shows that the crisp weekday work pattern is driven mostly by Europe, which has by far the sharpest separation between work and personal use through the afternoon. North America is the opposite: work and personal conversations track each other almost exactly all day, which reads as AI being adopted for personal life as much as for the job.
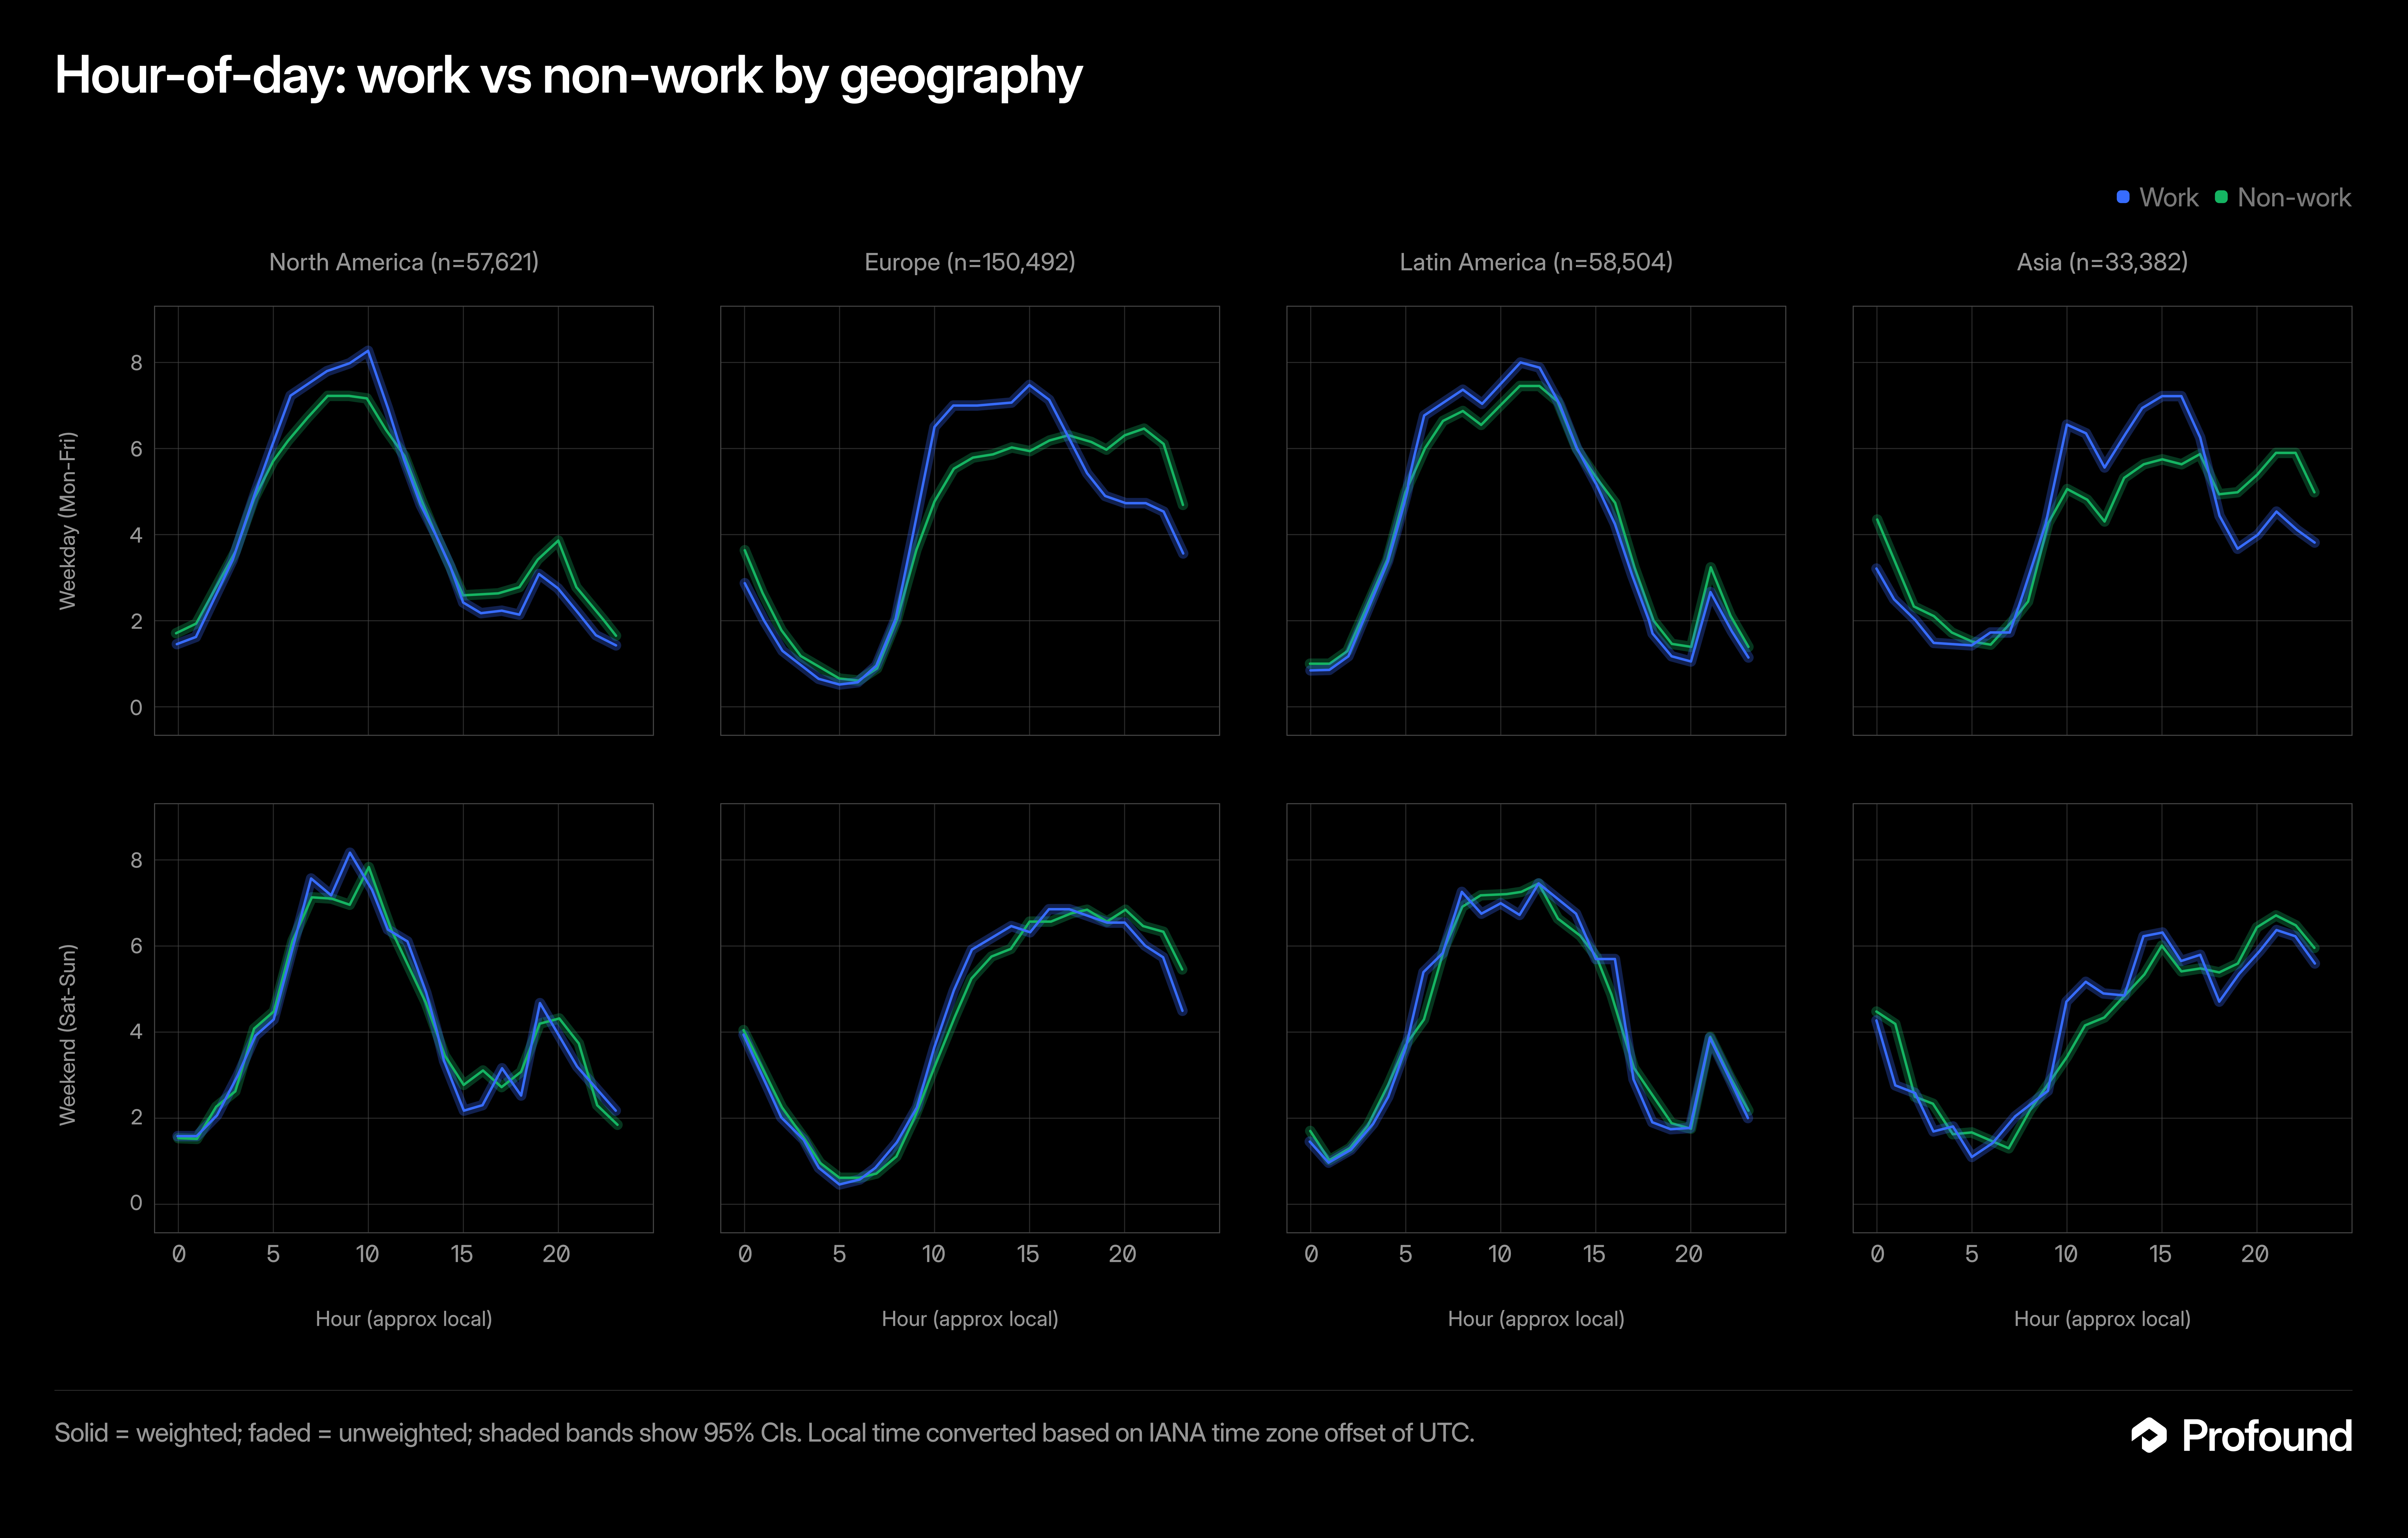
Figure 2. Work vs non-work share by local hour, platforms pooled within region.
Every region except North America also shows a lunchtime dip in volume around noon. This is most pronounced in Asia, where the midday dip survives even into the weekend. Latin America peaks earliest in the day and, like North America, shows a small evening rise that leans personal rather than professional.
What this means: a US-centric read understates the workday effect. If you sell into Europe, expect a strong, afternoon-heavy professional pattern; in North America and Latin America, plan for AI as an all-day personal companion in addition to a nine-to-five work tool.
Age and income influence when people are online
Age and income sort people into schedules. Older and higher-income users concentrate in weekday late mornings; younger and lower-income users spread out and lean into evenings and weekends.
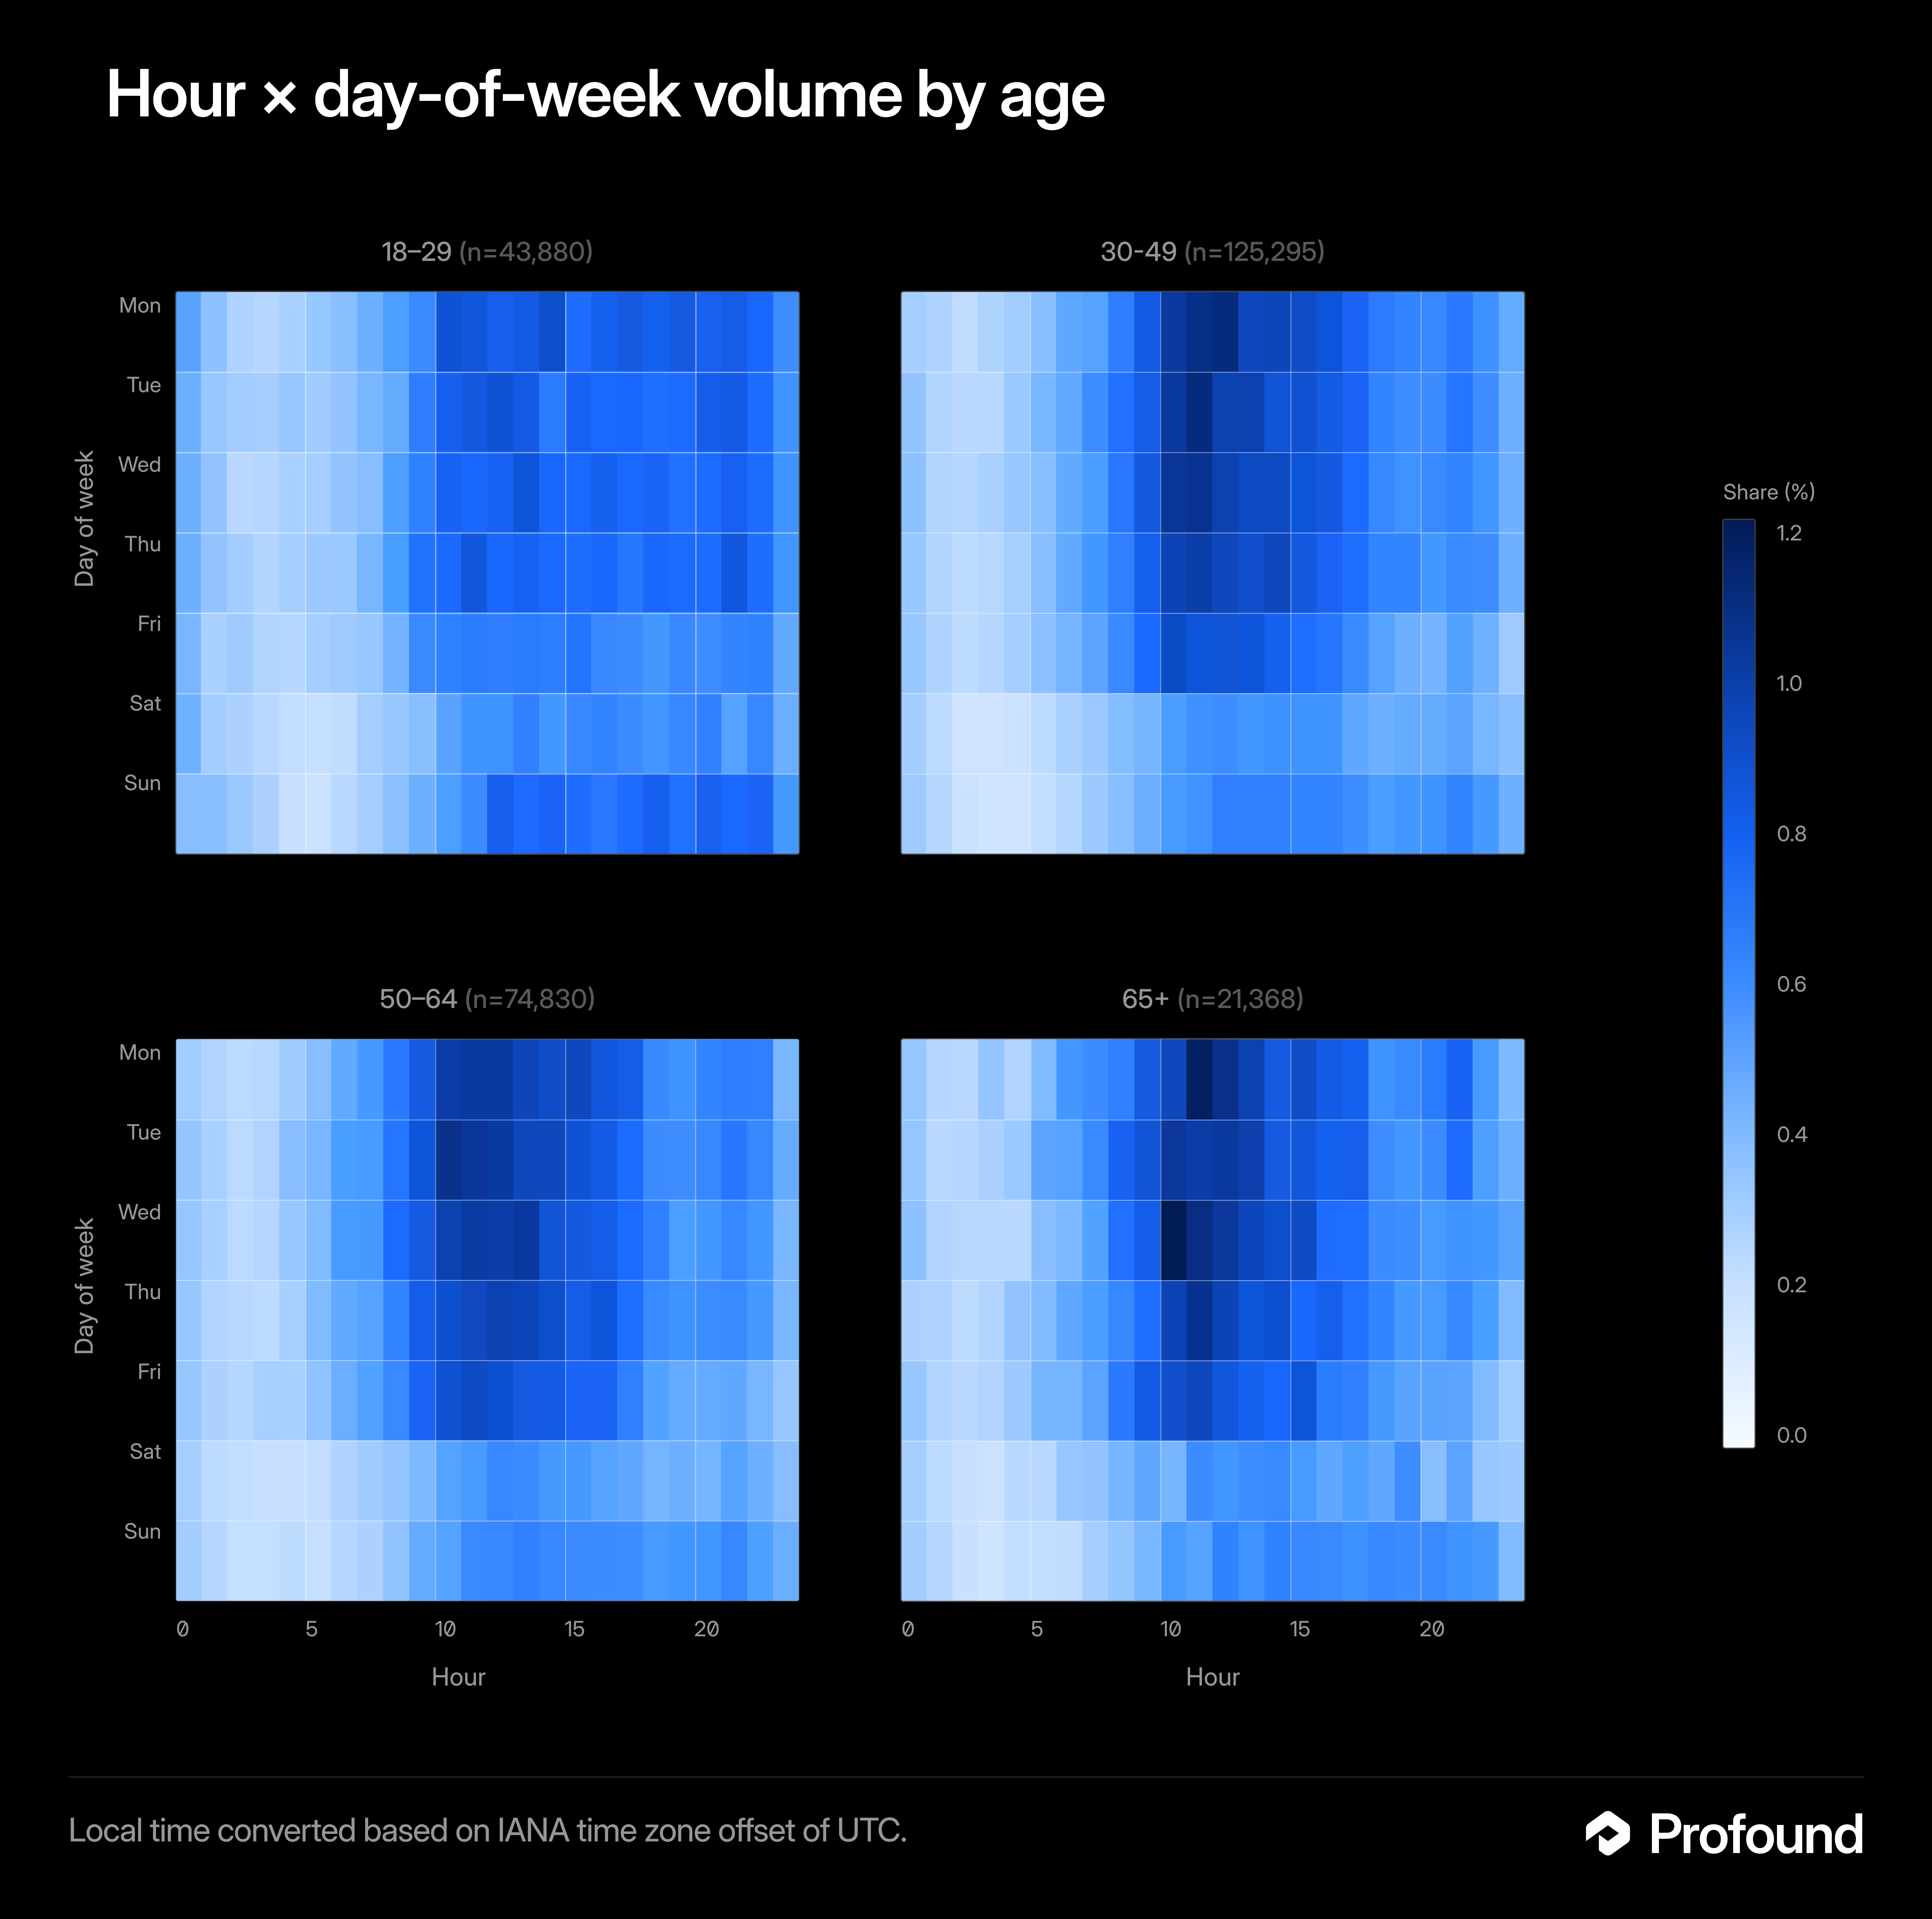
Figure 3. Hour × day-of-week conversation volume by age, platforms pooled. Each cell is the share of that age group's conversations.
The 30–49 group is the densest weekday-midday block. The 65+ group is the most concentrated of all, packed into weekday late mornings and dropping off early in the evening. The under-29s are the mirror image: their usage skews latest in the day and shows the strongest weekend presence, peaking on Sunday afternoons and evenings.
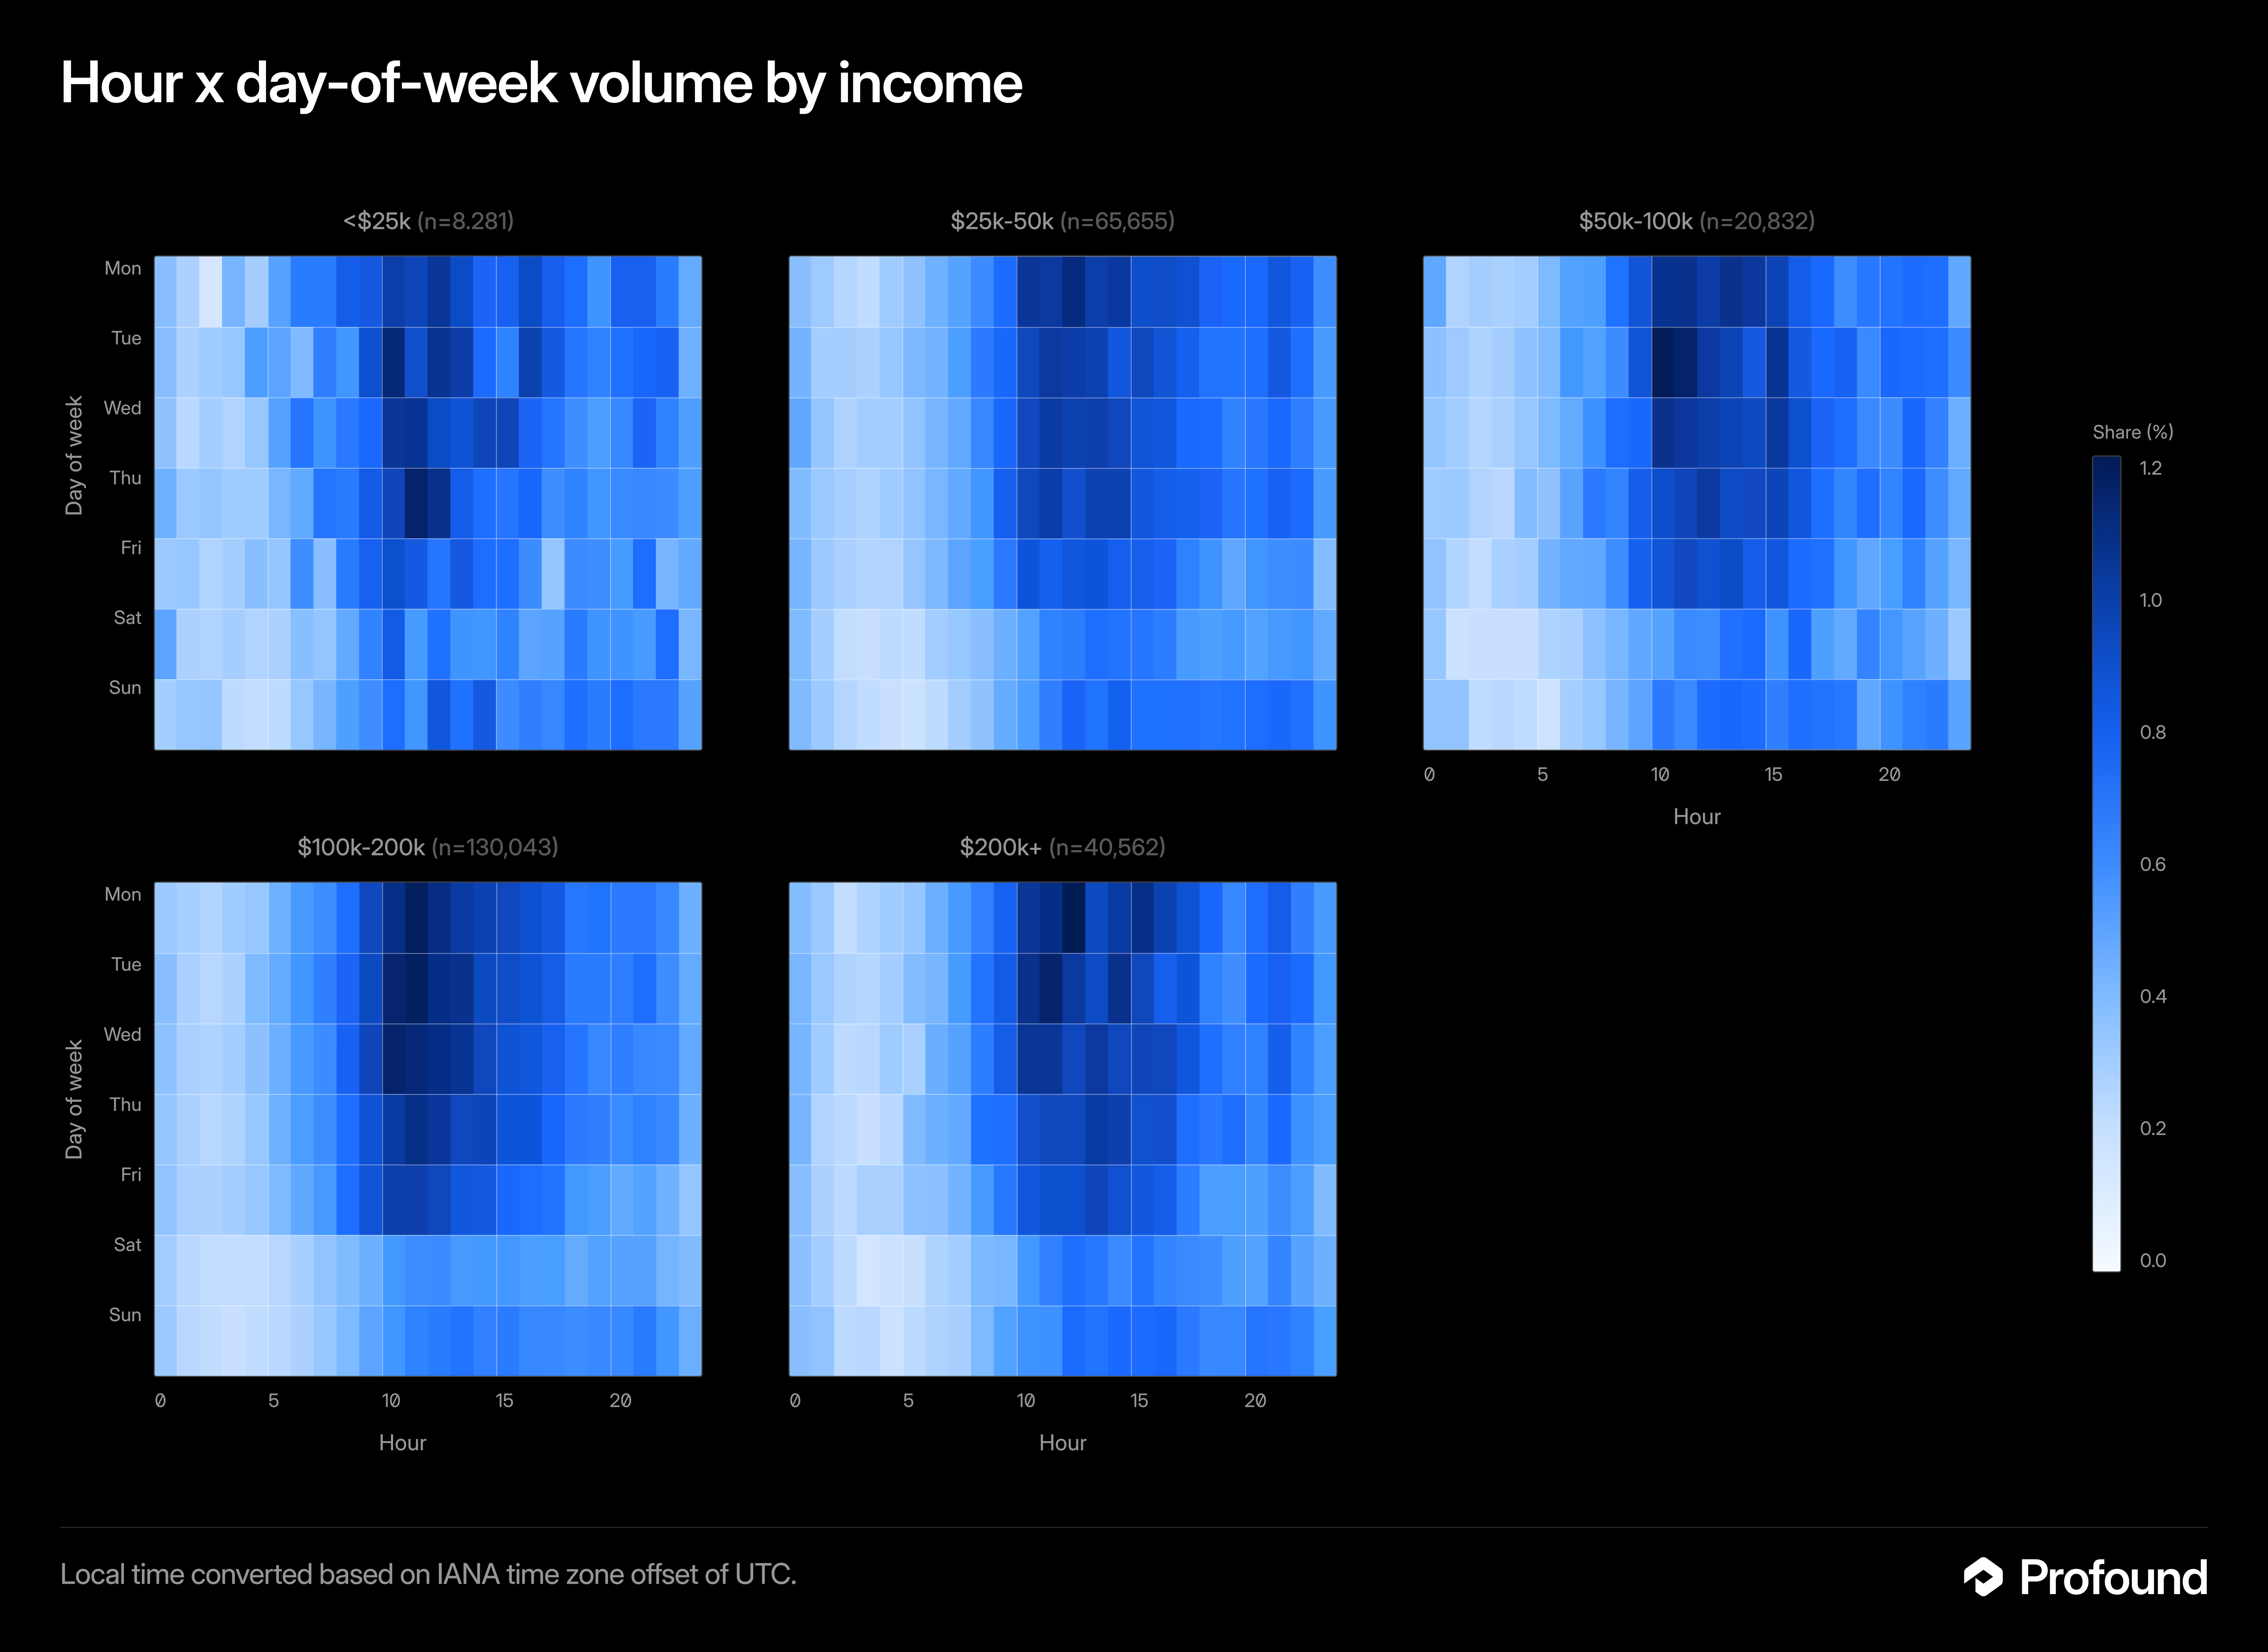
Figure 4. Hour × day-of-week conversation volume by household income, platforms pooled.
Income tells a parallel story. The $100–200k bucket shows the tightest weekday work-hours block. The under-$25k bucket is the least structured around a standard workday and the most spread out, warm across nearly all hours after 5am and across every day of the week. The highest earners, $200k+, are most active earlier in the week (notably, Monday mornings). These gradients line up with independent reports that heavier AI use skews toward higher-income, professional users, including Anthropic's finding that Claude use is more intense in high-income areas.
What this means: audience timing is demographic. To reach older buyers, weekday work hours are the window; to reach a young consumer audience, Sunday evening is prime time.
Each assistant has a specialty, and the weekend rewrites it
Each platform has a clear top topic, which remains stable all week. ChatGPT's is writing at about 28% of weekday conversations, Claude's is programming at about 35%, and Gemini's is multimedia generation at about 29%. On each platform, the leading topic runs well ahead of the next.
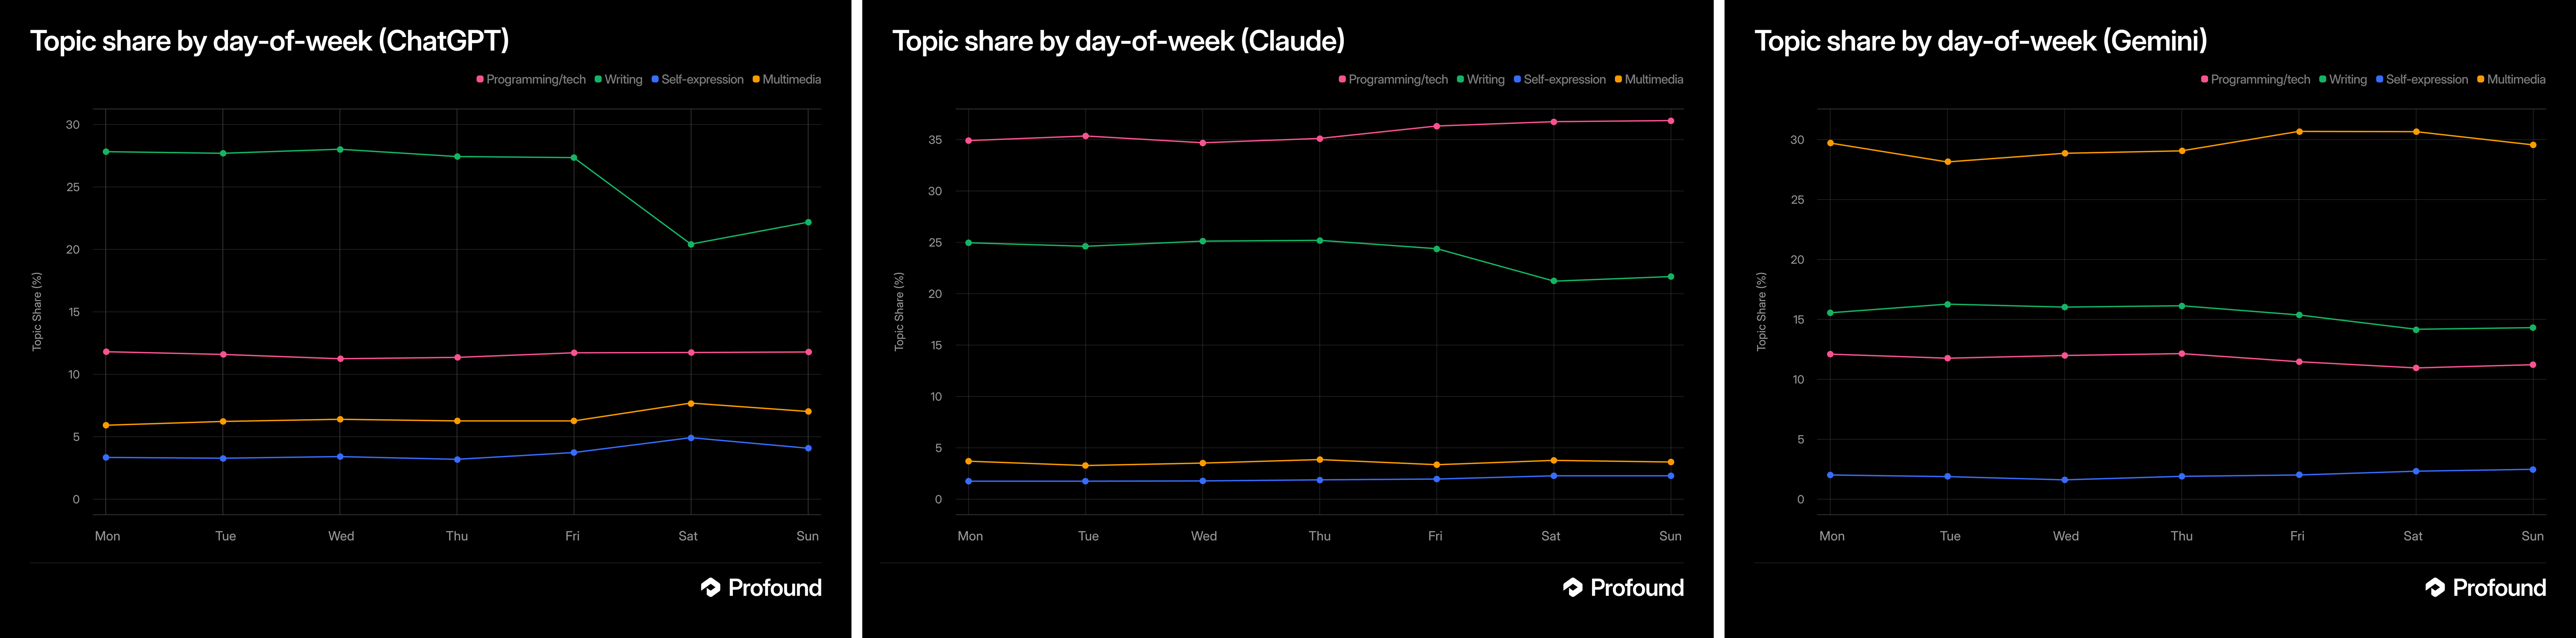
Figure 5. Topic share by day of week, selected coarse topics, by platform.
Movement occurs over the weekend. Writing falls everywhere on weekends, and hardest on ChatGPT, dropping from 28% on weekdays to 21% on weekends. Claude's programming share actually rises slightly into the weekend, from 35% to 37%, suggesting that people may be relying on the tool also for personal projects.
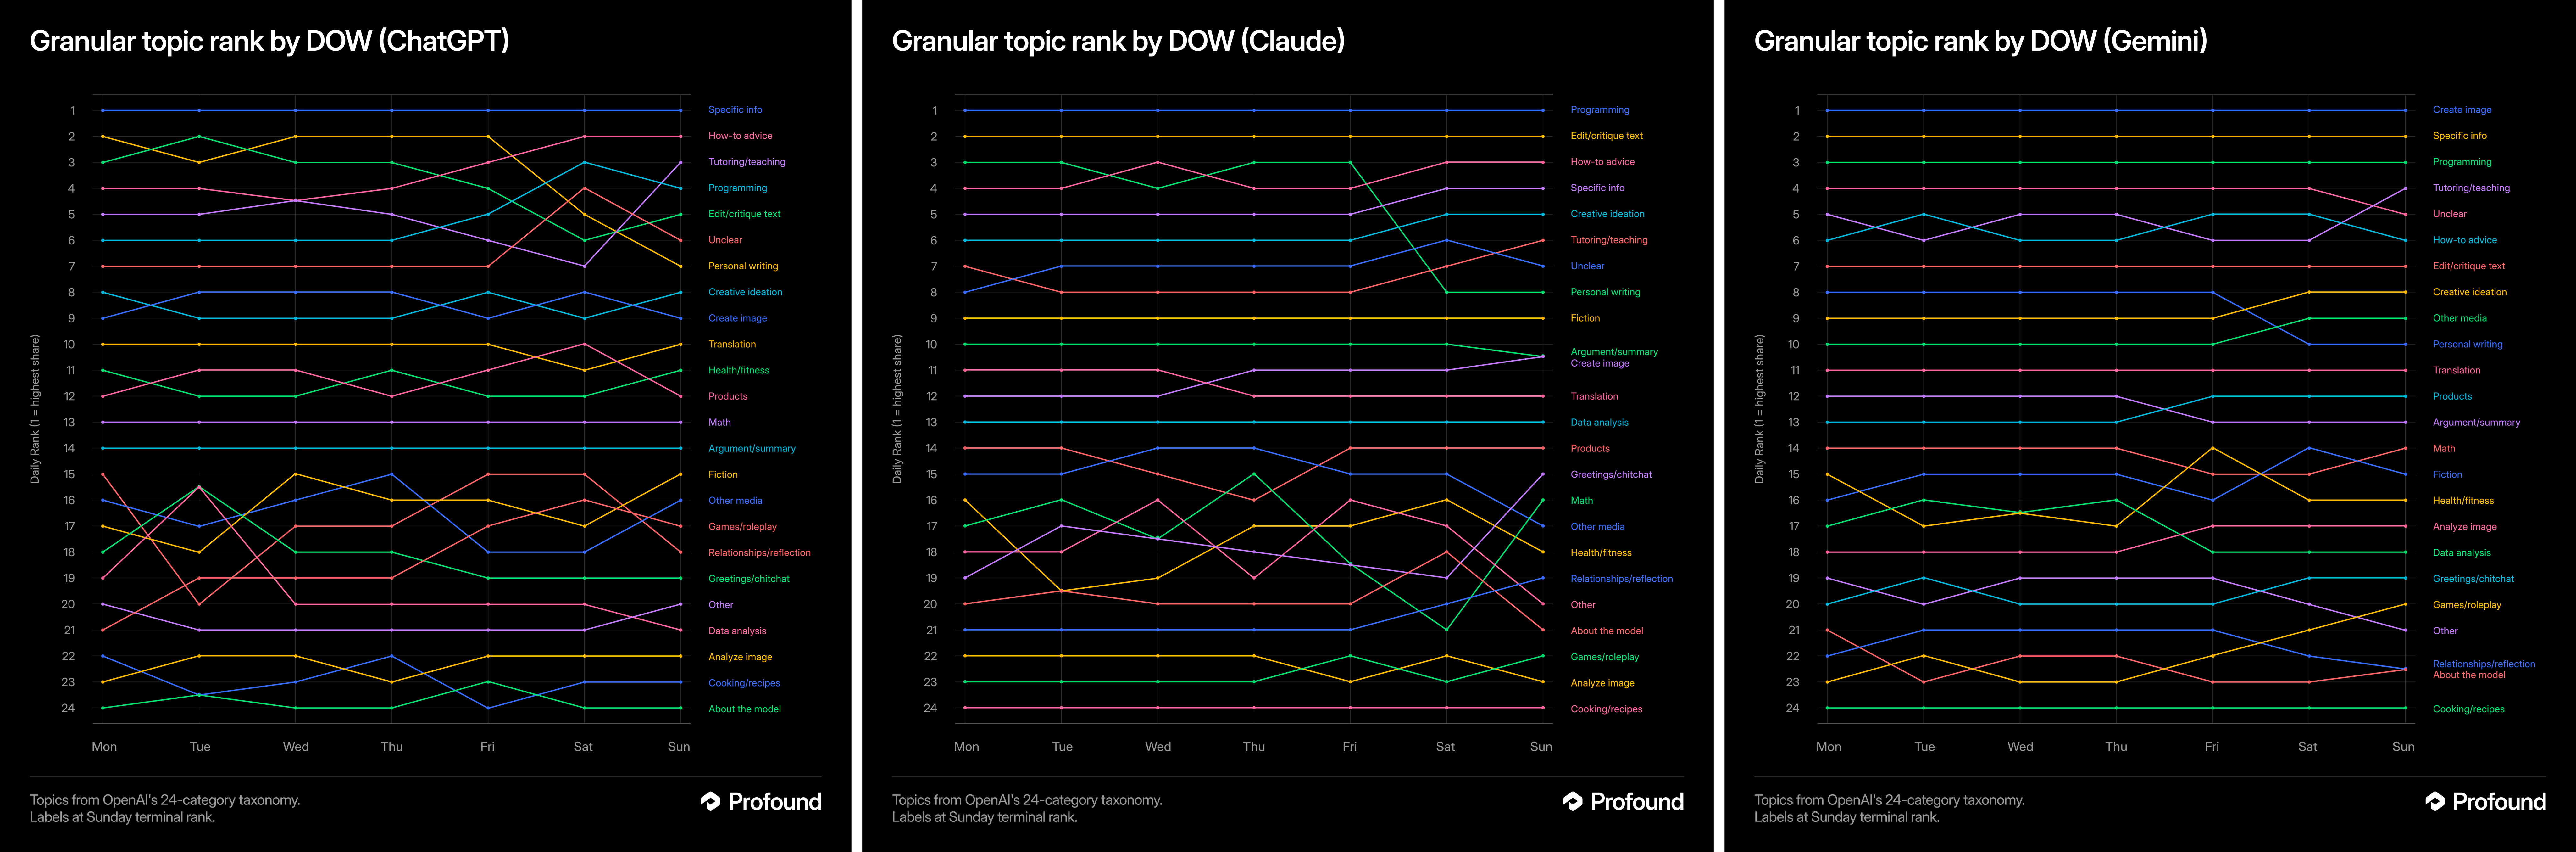
Figure 6. Topic rank by day of week, all 24 granular topics, by platform. Rank 1 is the highest share. Labels sit at each topic's Sunday rank.
Ranking the finer-grained topics shows the same handover. On ChatGPT, editing and critiquing text slides from a weekday rank near 3 to about 7 on Saturday, while fiction, cooking, and tutoring climb into the weekend. On Claude, math and data analysis fall on Saturday while creative ideation rises toward Sunday. Gemini is the steadiest of the three, with image creation locked at the top every day and only tutoring and creative ideation nudging up on the weekend.
What this means: the platform tells you the job and the day tells you the appetite. Presence should be matched to what each assistant is actually used for: ChatGPT for writing, Claude for building, Gemini for visuals. Expect a weekday-work to weekend-creative shift in the questions people ask.
What this means for your brand
"AI" is not a single channel. When your customers reach for an assistant, which one they pick, what they ask, and what hour it is are all correlated with who they are and where they live.
- Time monitoring to the audience. Affluent and older buyers are reachable on weekday mornings; young consumers on Sunday night. Global brands must think in each region's local clock.
- Expect the weekend to change the questions. Writing and analysis recede while creative, cooking, tutoring, and game-related prompts rise.
- Respect the platform specialties. A writing-heavy brand has the most surface on ChatGPT, a developer tool on Claude, a visual product on Gemini, and the specialties barely move day to day.
Getting started
Your customers are asking ChatGPT, Gemini, and Claude different questions at different hours. See how Profound tracks your brand's visibility across AI platforms so you show up on each of them, at the moments that matter.
Methodology
Data and privacy. The analysis draws on a sample from Profound's datasets: 100,000 conversations each from ChatGPT, Claude, and Gemini, from 195,907 unique users across 27 countries, spanning July 14, 2025 to June 15, 2026. Prompts were anonymized and summarized before any analysis, and no human ever read a raw user query for this analysis. The age and income analyses cover the subset of conversations with known demographics (about 265,000). Desktop accounts for about 70% of conversations and mobile 30% on each platform. Country coverage differs: ChatGPT 27 countries, Gemini 21, Claude 9. Conversations are bucketed by approximate local hour and day of week.
Classification. An LLM-as-a-judge assigned each conversation a work/non-work label and a topic, following the taxonomy and classification prompt from OpenAI's How People Use ChatGPT study (Chatterji et al., 2025), which uses a 24-category topic scheme. The coarse topics in Figures 5 and 6 aggregate those categories. The classifier was validated against the public WildChat conversation dataset; validation details are available on request.
Estimators. Work/non-work curves are demographic-rake weighted (solid lines) and shown unweighted for comparison (faded lines), with 95% CIs computed per hour on the weighted lines.
Limitations. The data is a sample from a panel, so shares describe relative timing rather than absolute volumes. Heatmaps are normalized within each bucket and should not be compared across buckets of different sizes; moreover, demographic timing claims read from them (for example, high earners skewing earlier in the week) are directional.

